概述
超趋势双均线策略是一种基于超趋势指标和简单移动平均线的量化交易策略。该策略利用超趋势指标判断市场趋势方向,再结合200日简单移动平均线进行过滤,在大趋势方向上开仓做多做空。
策略原理
该策略使用两个指标:
超趋势指标:它根据真实波幅ATR和一个乘数来计算上轨和下轨。当收盘价高于上轨就是看涨,低于下轨就是看跌。
200日简单移动平均线:它对最近200天的收盘价进行算术平均。收盘价高于该线代表大趋势看涨,低于该线代表大趋势看跌。
策略逻辑:
当超趋势指标看涨(超趋势指标值大于0)并且收盘价高于200日均线时,做多头入场。
当超趋势指标看跌(超趋势指标值小于0)并且收盘价低于200日均线时,做空头入场。
当超趋势指标与之前信号反向时平仓出场。
止损设置为25%。
优势分析
该策略结合超趋势指标判断短期趋势和200日均线判断长期趋势,能有效过滤假突破,降低交易频率的同时提高胜率。在大的行情中,趋势足够明确,止损空间大,盈利空间大。
风险分析
该策略的主要风险在于止损幅度较大,高杠杆情况下会Increase the risk of forced liquidation。此外,当行情盘整时,超趋势指标会产生多余信号,从而增加交易频率和成本。
可通过适当调整ATR周期、乘数参数以及止损幅度来降低风险。
优化方向
该策略可以从以下几个方面进行优化:
调整ATR周期和乘数参数,优化超趋势指标的参数;
尝试其它均线指标,如EMA、VIDYA等进行替换;
增加其它辅助指标,如BOLL通道或KD指标进一步过滤信号;
优化止损策略,如移至盈亏平衡点或随大级别止损。
总结
本策略整体来说非常实用,既考虑了短期趋势判断又考虑了长期趋势判断,止损设置也较为合理。通过参数调整与优化仍可获得更好的效果,值得实盘验证与运用。
策略源码
/*backtest
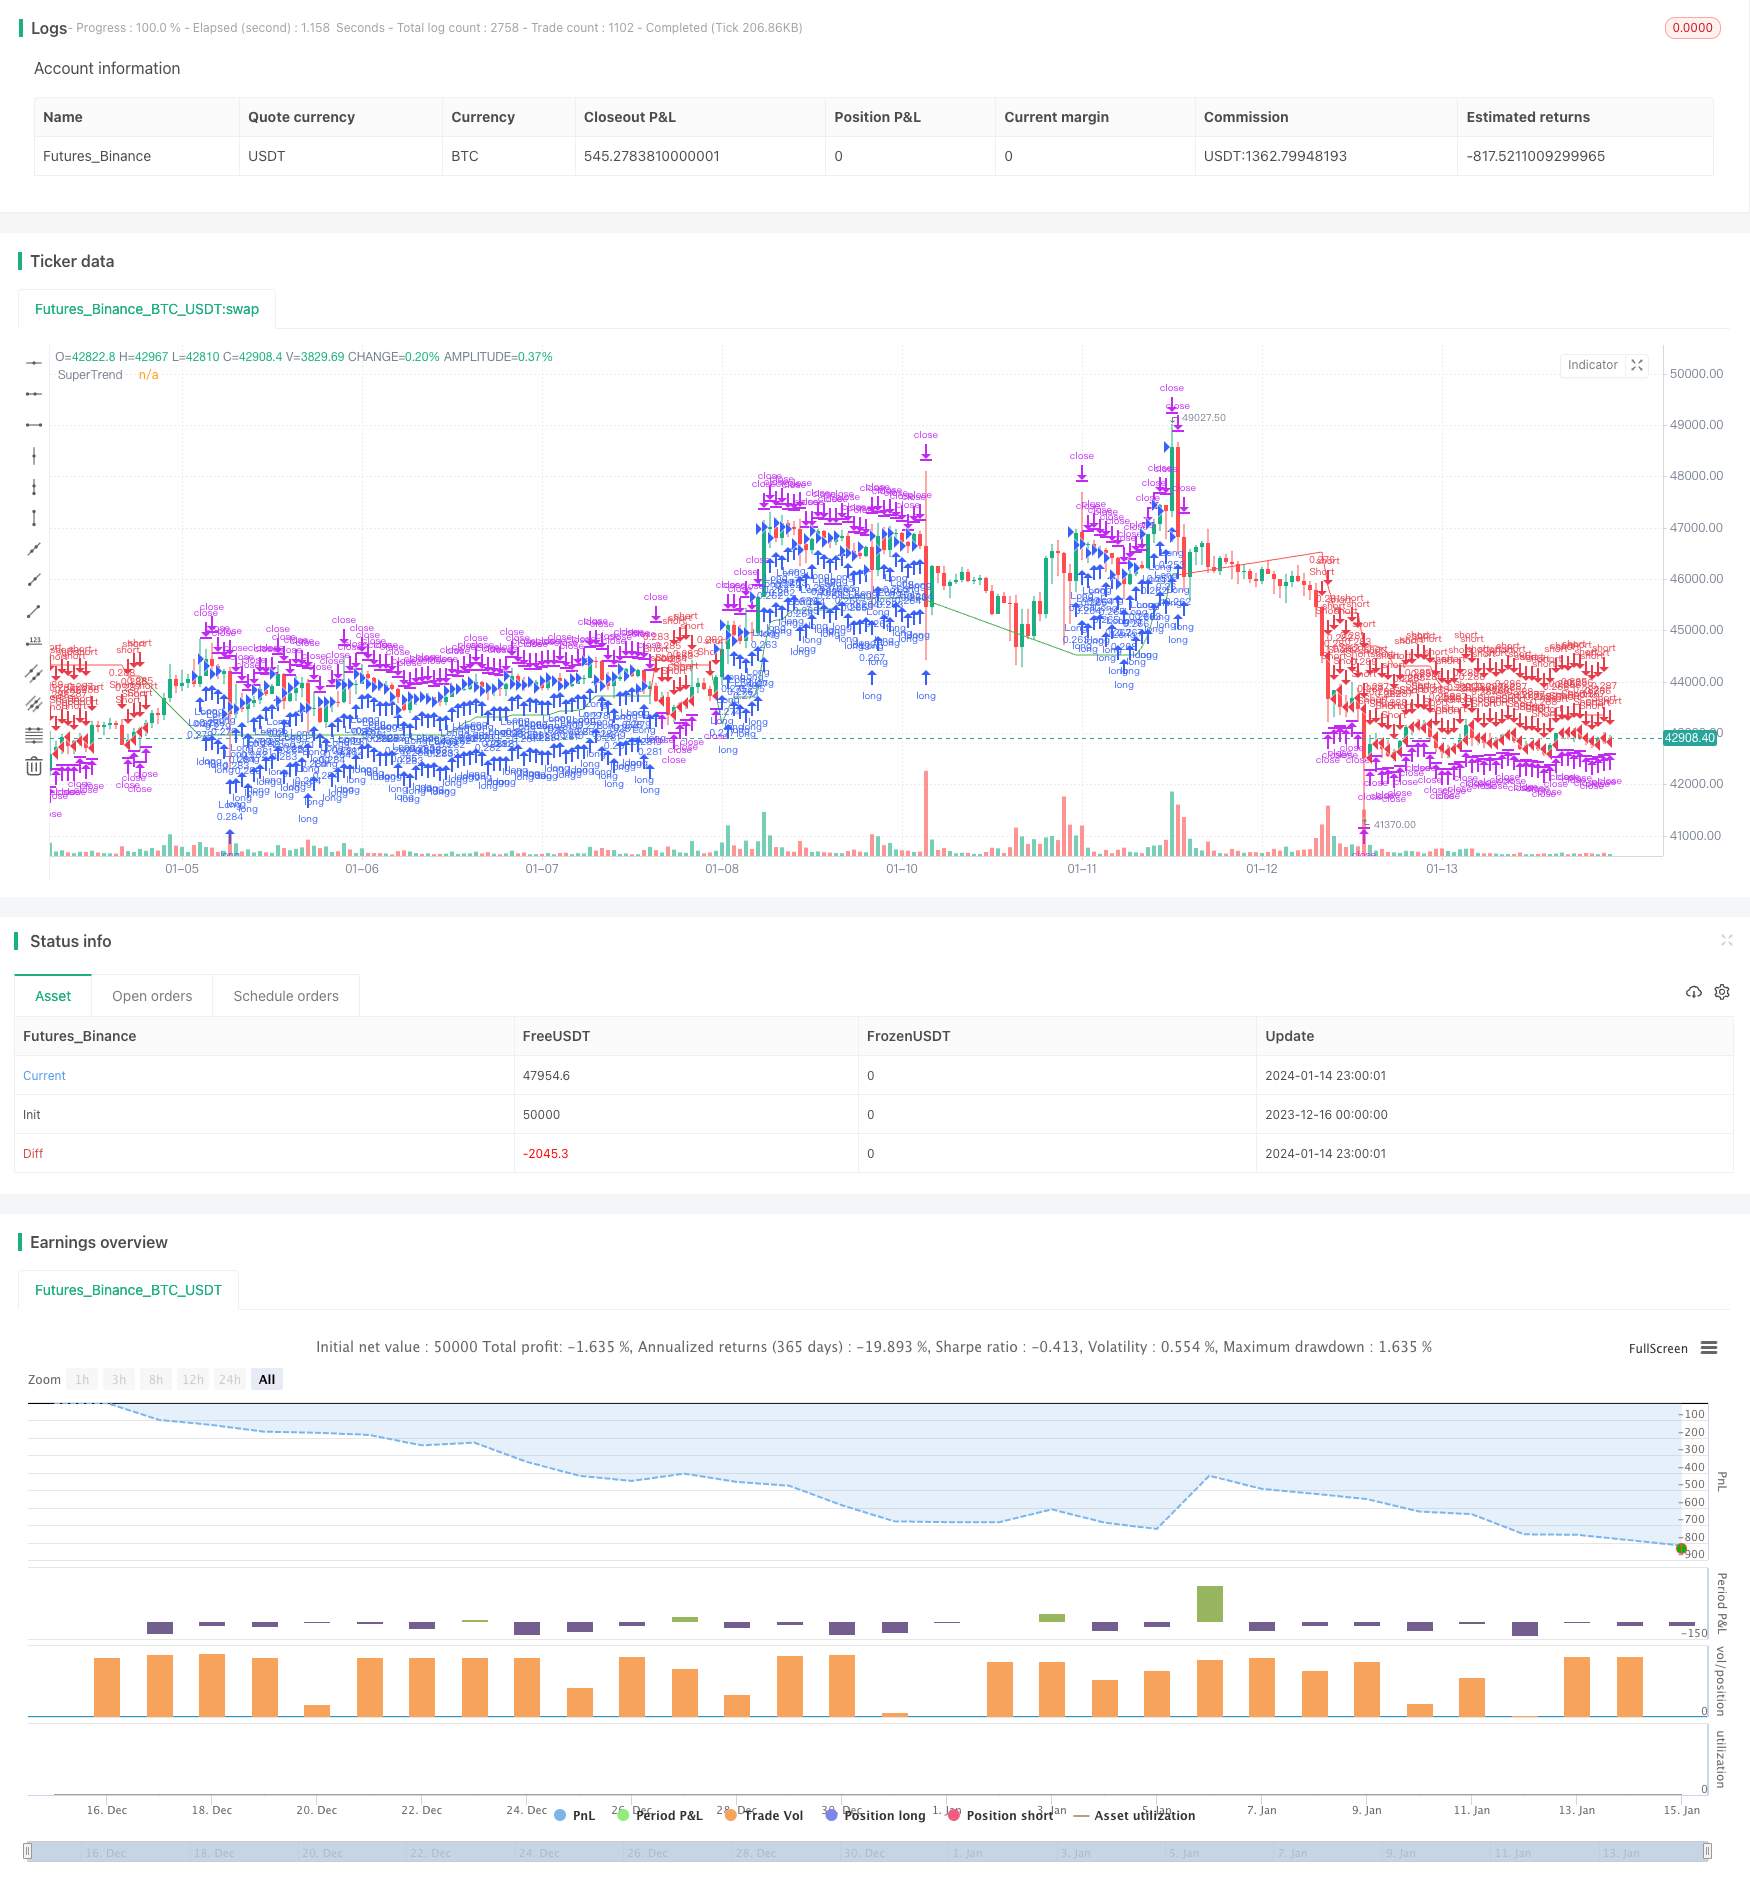
start: 2023-12-16 00:00:00
end: 2024-01-15 00:00:00
period: 1h
basePeriod: 15m
exchanges: [{"eid":"Futures_Binance","currency":"BTC_USDT"}]
*/
// This work is licensed under a Attribution-NonCommercial-ShareAlike 4.0 International (CC BY-NC-SA 4.0) https://creativecommons.org/licenses/by-nc-sa/4.0/
// © wielkieef
//@version=5
strategy("Smart SuperTrend Strategy ", shorttitle="ST Strategy", overlay=true, pyramiding=1, initial_capital=10000, default_qty_type=strategy.percent_of_equity, default_qty_value=25, calc_on_order_fills=false, slippage=0, commission_type=strategy.commission.percent, commission_value=0.01)
// Parametry wskaźnika SuperTrend
atrLength = input(10, title="Lenght ATR")
factor = input(3.0, title="Mult.")
// Parametry dla SMA
lengthSMA = input(200, title="Lenght SMA")
// Parametry dla Stop Loss
sl = input.float(25.0, '% Stop Loss', step=0.1)
// Obliczanie ATR
atr = ta.atr(atrLength)
// Obliczanie podstawowej wartości SuperTrend
up = hl2 - (factor * atr)
dn = hl2 + (factor * atr)
// Obliczanie 200-SMA
sma200 = ta.sma(close, lengthSMA)
// Inicjalizacja zmiennych
var float upLevel = na
var float dnLevel = na
var int trend = na
var int trendWithFilter = na
// Logika SuperTrend
upLevel := close[1] > upLevel[1] ? math.max(up, upLevel[1]) : up
dnLevel := close[1] < dnLevel[1] ? math.min(dn, dnLevel[1]) : dn
trend := close > dnLevel[1] ? 1 : close < upLevel[1] ? -1 : nz(trend[1], 1)
// Filtr SMA i aktualizacja trendWithFilter
trendWithFilter := close > sma200 ? math.max(trend, 0) : math.min(trend, 0)
// Logika wejścia
longCondition = trend == 1
shortCondition = trend == -1
// Wejście w pozycje
if (longCondition) and close > sma200
strategy.entry("Long", strategy.long)
if (shortCondition) and close < sma200
strategy.entry("Short", strategy.short)
// Warunki zamknięcia pozycji
Long_close = trend == -1 and close > sma200
Short_close = trend == 1 and close < sma200
// Zamknięcie pozycji
if (Long_close)
strategy.close("Long")
if (Short_close)
strategy.close("Short")
// Kolory superTrendu z filtrem sma200
trendColor = trendWithFilter == 1 ? color.green : trendWithFilter == -1 ? color.red : color.blue
//ploty
plot(trendWithFilter == 1 ? upLevel : trendWithFilter == -1 ? dnLevel : na, color=trendColor, title="SuperTrend")
// Stop Loss ( this code is from author RafaelZioni, modified by wielkieef )
per(procent) =>
strategy.position_size != 0 ? math.round(procent / 100 * strategy.position_avg_price / syminfo.mintick) : float(na)
// --------------------------------------------------------------------------------------------------------------------
strategy.exit('SL',loss=per(sl))
//by wielkieef