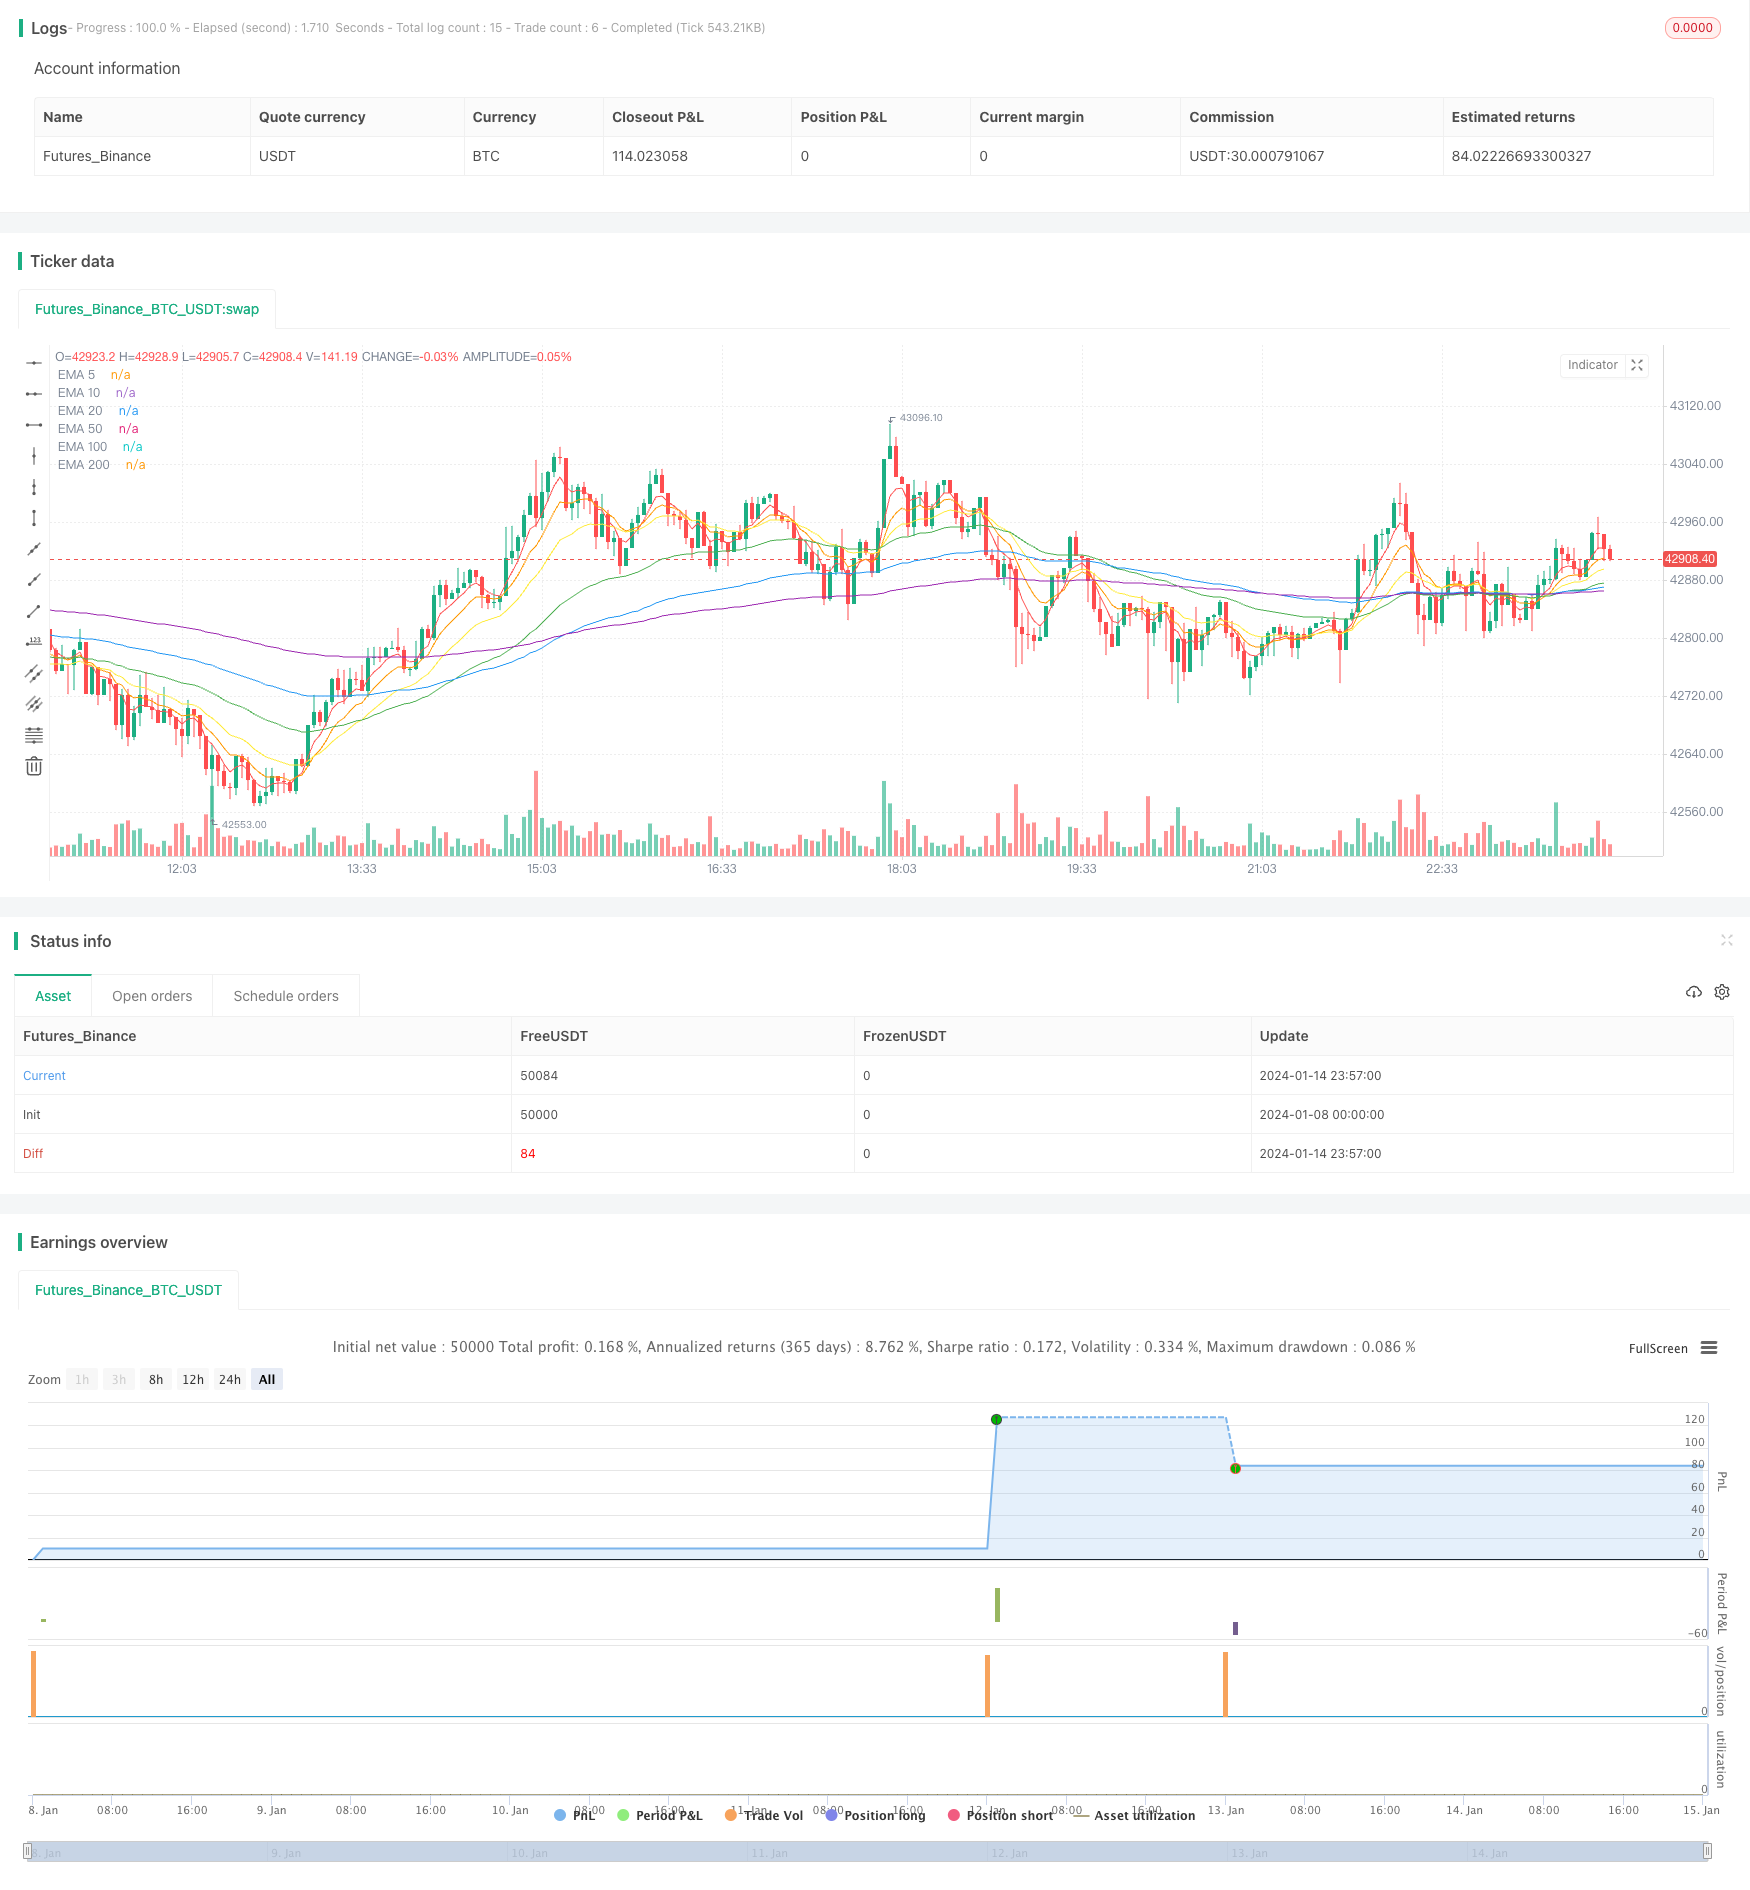
概述
这个Pine脚本策略在TradingView平台上实现了一种每日均成本策略,同时结合了EMA指标的触碰信号来确定入场点。策略遵循均成本投资法则,每天以固定金额进行买入,以分散风险。同时,通过EMA的触碰信号来指导具体的入场时机。
策略原理
该策略主要具有以下几个特点:
每日均成本投资法则
- 每天以固定金额进行买入,无论市场涨跌
- 长期分散投资,降低单笔投资的风险
EMA指标确定入场点
- 当收盘价上穿5日、10日、20日等EMA时,触发买入
- EMA线作为支持,能较好避开短期调整
动态止损机制
- 当收盘价跌破20日简单移动均线时,止损清仓
- 避免亏损进一步扩大
最大仓位限制
- 最大允许300笔交易,控制仓位规模和风险
- 防止过度投资导致的资金不足
具体来说,策略每天投入固定金额,按当日收盘价计算可以购买的股票数量。在这个基础上,如果当天的收盘价上穿5日、10日、20日等EMA中的任意一条时,就会触发买入信号。一旦累积的仓位达到最大限制的300笔时,就不会有新的买入操作。另外,如果收盘价跌破20日SMA,或者到达提前设定的退出日期,就会清仓止损。该策略还在价格图上绘制不同周期的EMA线,方便直观分析。
优势分析
该策略具有以下几个优势:
分散投资,降低单笔投资风险
- 每天进行小额、固定金额投资,无论涨跌
- 不会出现 reunrung 追高的问题
EMA结合,避开短期调整
- EMA上穿作为买入信号,避开回撤期间的买入
- 回撤期间继续分批买入,分散风险
动态止损,控制亏损
- 设定止损线,可以及时止损
- 防止出现大额亏损
最大仓位限制,控制风险
- 最大仓位可以预先设定,防止过度投资
- 在ETP承担能力范围内进行投资
直观的EMA显示,易于判定
- 价格图上绘制不同EMA周期的线
- 一目了然,便于操作员监控
高度可定制化
- 可以自定义投入金额、EMA周期、止损线等
- 根据个人风险偏好进行调整
风险分析
该策略也存在一些风险需要注意:
系统性风险难以规避
- 遇到黑天鹅事件,可能面临较大亏损
- 分散投资可以降低风险,无法完全规避
固定投资金额带来的风险
- 每天固定金额投入,价格剧烈上涨时可能后悔
- 可以采用动态调整投入金额的优化
EMA无法对极端行情作出反应
- EMA对突发事件反应迟缓,无法及时止损
- 可以考虑与KD、BOLL等指标结合,识别极端行情
仓位限制也限制了盈利空间
- 仓位有上限,无法无限增持
- 需要综合考量,在风险和收益间找到平衡
停损点设置需要经验和技巧
- 停损点过近则容易被突破,过远又无法及时止损
- 需要通过反复测试取得平衡
优化方向
该策略还具有进一步优化的空间:
增加动态调整每日投入金额
- 可以根据特定指标,动态调整每日投入
- 在看好行情时增加投入,看淡时减少
结合更多指标判断入场
- 除了EMA,还可以引入KD、BOLL等指标判定
- 提高对极端行情的判断能力
采用指数移动平均
- EMA对突发事件反应迟缓,可以考虑采用DEMA、TEMA等
- 更快捕捉新的趋势方向
动态调整最大仓位
- 可以根据策略盈利情况,动态调整最大仓位
- 在估值合理时适当加大仓位
采用渐进式止损
- 现有策略为直接清仓止损,可以采用渐进清仓
- 防止止损点被「抄底」的风险
总结
总的来说,该每日均成本策略结合EMA触碰信号,实现了长期分批投资的思路。相比单次大手开仓,可以分散风险,避免在高点狂欢。EMA的加入也在一定程度上避让了短期调整带来的风险,采取止损措施控制最大亏损。同时,仍需要注意黑天鹅风险,以及固定投入金额无法充分抓住机会带来的遗憾等问题。这些都为策略进一步的优化提供了方向。通过参数调整与指标组合,可以逐步优化并实现既高效又稳定的量化交易策略。
策略源码
/*backtest
start: 2024-01-08 00:00:00
end: 2024-01-15 00:00:00
period: 3m
basePeriod: 1m
exchanges: [{"eid":"Futures_Binance","currency":"BTC_USDT"}]
*/

//@version=4
strategy("Daily DCA Strategy with Touching EMAs", overlay=true, pyramiding=10000)

// Customizable Parameters
daily_investment = input(50000, title="Daily Investment")
start_year = input(2022, title="Start Year")
start_month = input(1, title="Start Month")
start_day = input(1, title="Start Day")
end_year = input(2023, title="End Year")
end_month = input(12, title="End Month")
end_day = input(1, title="End Day")
trade_count_limit = input(10000, title="Pyramiding Limit")
enable_sell = input(true, title="Enable Sell")

start_date = timestamp(start_year, start_month, start_day)
var int trade_count = 0

// Calculate the number of shares to buy based on the current closing price
shares_to_buy = daily_investment / close

// Check if a new day has started and after the start date
isNewDay = dayofmonth != dayofmonth[1] and time >= start_date

// Buy conditions based on EMA crossovers
ema5_cross_above = crossover(close, ema(close, 5))
ema10_cross_above = crossover(close, ema(close, 10))
ema20_cross_above = crossover(close, ema(close, 20))
ema50_cross_above = crossover(close, ema(close, 50))
ema100_cross_above = crossover(close, ema(close, 100))
ema200_cross_above = crossover(close, ema(close, 200))

if isNewDay and (ema5_cross_above or ema10_cross_above or ema20_cross_above or ema50_cross_above or ema100_cross_above or ema200_cross_above) and trade_count < trade_count_limit
    strategy.entry("Buy", strategy.long, qty=shares_to_buy)
    trade_count := trade_count + 1

// Dynamic sell conditions (optional)
sell_condition =  true

if enable_sell and sell_condition
    strategy.close_all()

// EMA Ribbon for visualization
plot(ema(close, 5), color=color.red, title="EMA 5")
plot(ema(close, 10), color=color.orange, title="EMA 10")
plot(ema(close, 20), color=color.yellow, title="EMA 20")
plot(ema(close, 50), color=color.green, title="EMA 50")
plot(ema(close, 100), color=color.blue, title="EMA 100")
plot(ema(close, 200), color=color.purple, title="EMA 200")