ADX Momentum Trend Strategy

1
Follow
1802
Followers
Overview
This strategy uses the ADX indicator to determine the market trend, combines with the DMI indicator to determine direction, utilizes the ADX slope to gauge trend strength, sets the ADX key level to filter non-trending markets, and uses a moving average to filter trade signals.
Strategy Logic
- Calculate the ADX, DI+, and DI- indicators.
- ADX slope > 0 indicates an increasing trend; key level is set to 23 to filter non-trending markets.
- DI+ above DI- signifies bullish momentum overrides bearish momentum, giving a buy signal.
- When moving average filter is enabled, only generate buy signals when close is above the moving average.
- Close positions when ADX slope < 0, indicating fading trend.
Advantage Analysis
- MA filter reduces noise trades in non-trending markets.
- ADX slope accurately determines trend strength.
- DI indicates direction combined with ADX for strength forms a robust trend trading system.
- Expect lower drawdown and higher profit factor than simple MA strategies.
Risk Analysis
- ADX results vary significantly with different input parameters.
- DMI may give false signals before direction is clearly determined.
- Some lag exists, reducing strategy efficiency.
Optimization Directions
- Optimize ADX parameters for best results.
- Add stop loss to limit loss on single trades.
- Try combining other indicators to filter signals, e.g. RSI, Bollinger Bands.
Summary
This strategy fully utilizes ADX’s strength in determining trend and momentum, combined with DMI for direction analysis, forming a complete trend following system. The MA filter effectively reduces noise. Further parameter tuning and indicator combinations may improve robustness and efficiency. In summary, by incorporating trend, momentum and direction analysis, this strategy has the potential to achieve strong returns.
Source
Pine
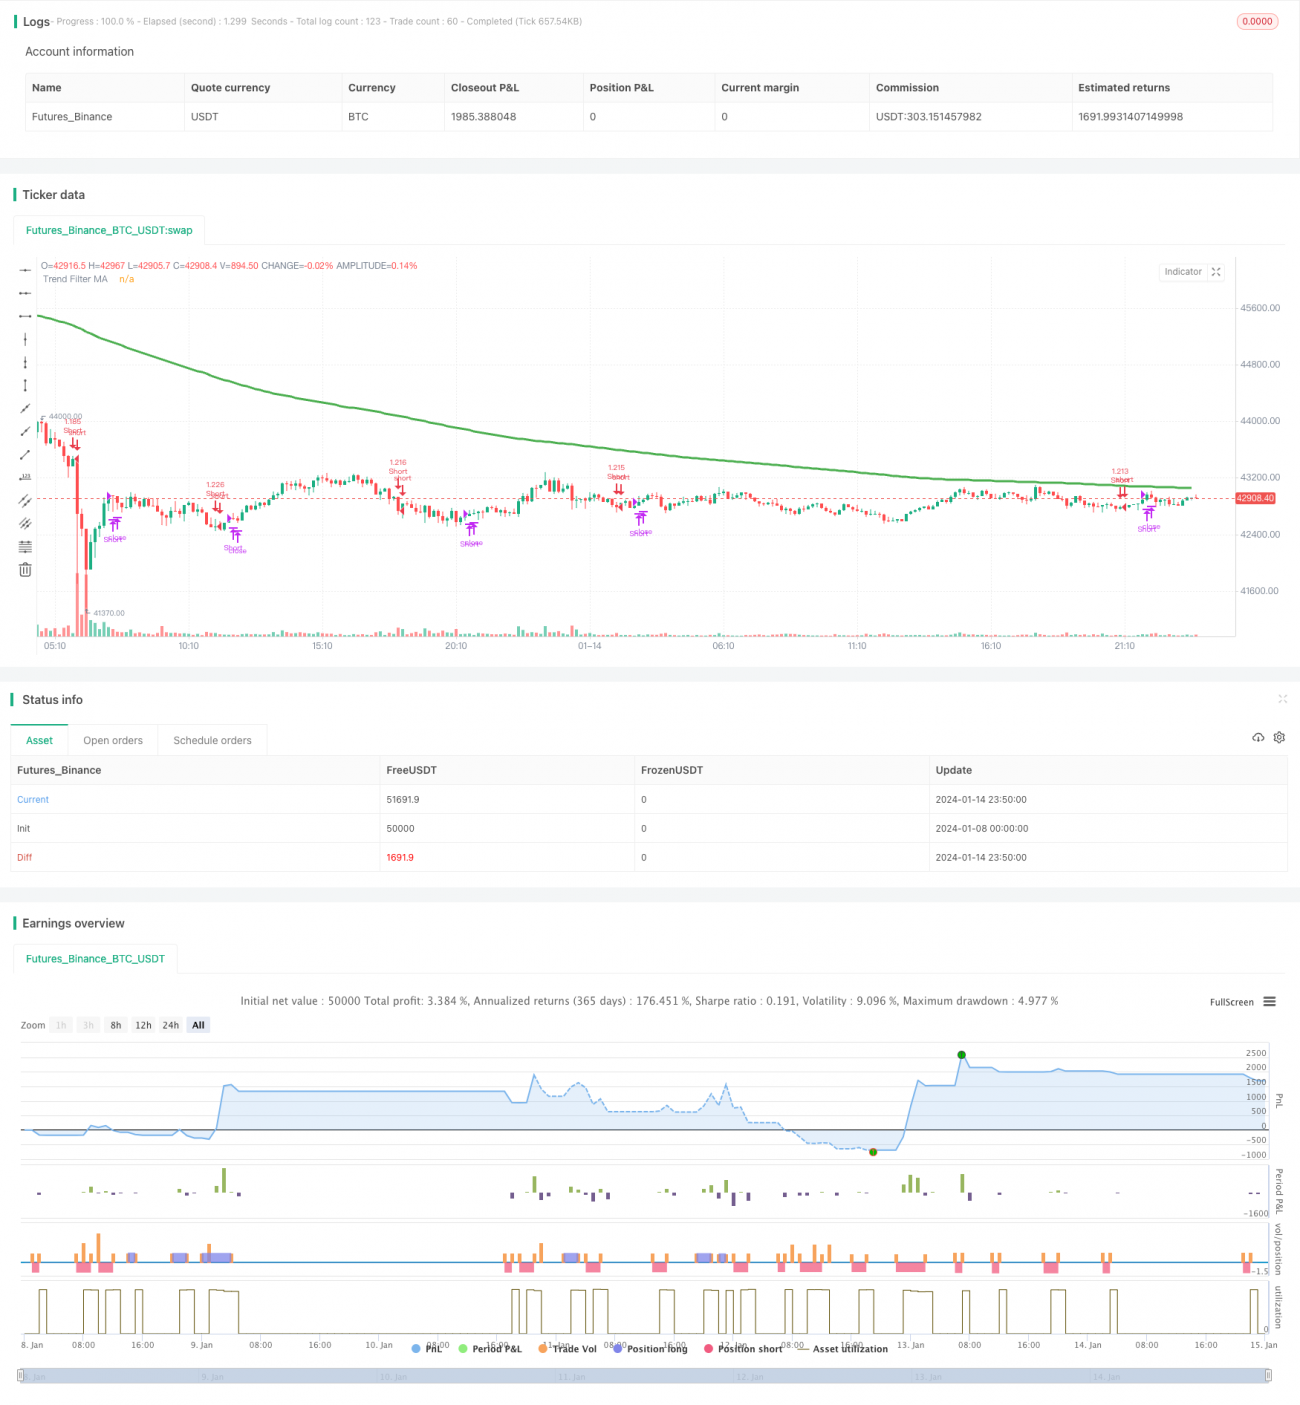
/*backtest
start: 2024-01-08 00:00:00
end: 2024-01-15 00:00:00
period: 10m
basePeriod: 1m
exchanges: [{"eid":"Futures_Binance","currency":"BTC_USDT"}]
*/

//@version=4
// This source code is subject to the terms of the Mozilla Public License 2.0 at https://mozilla.org/MPL/2.0/
// © millerrh with inspiration from @9e52f12edd034d28bdd5544e7ff92e
//The intent behind this study is to look at ADX when it has an increasing slope and is above a user-defined key level (23 default). Strategy parameters
Related strategies
Comment
All comments (0)
No data
- 1