一、策略概述
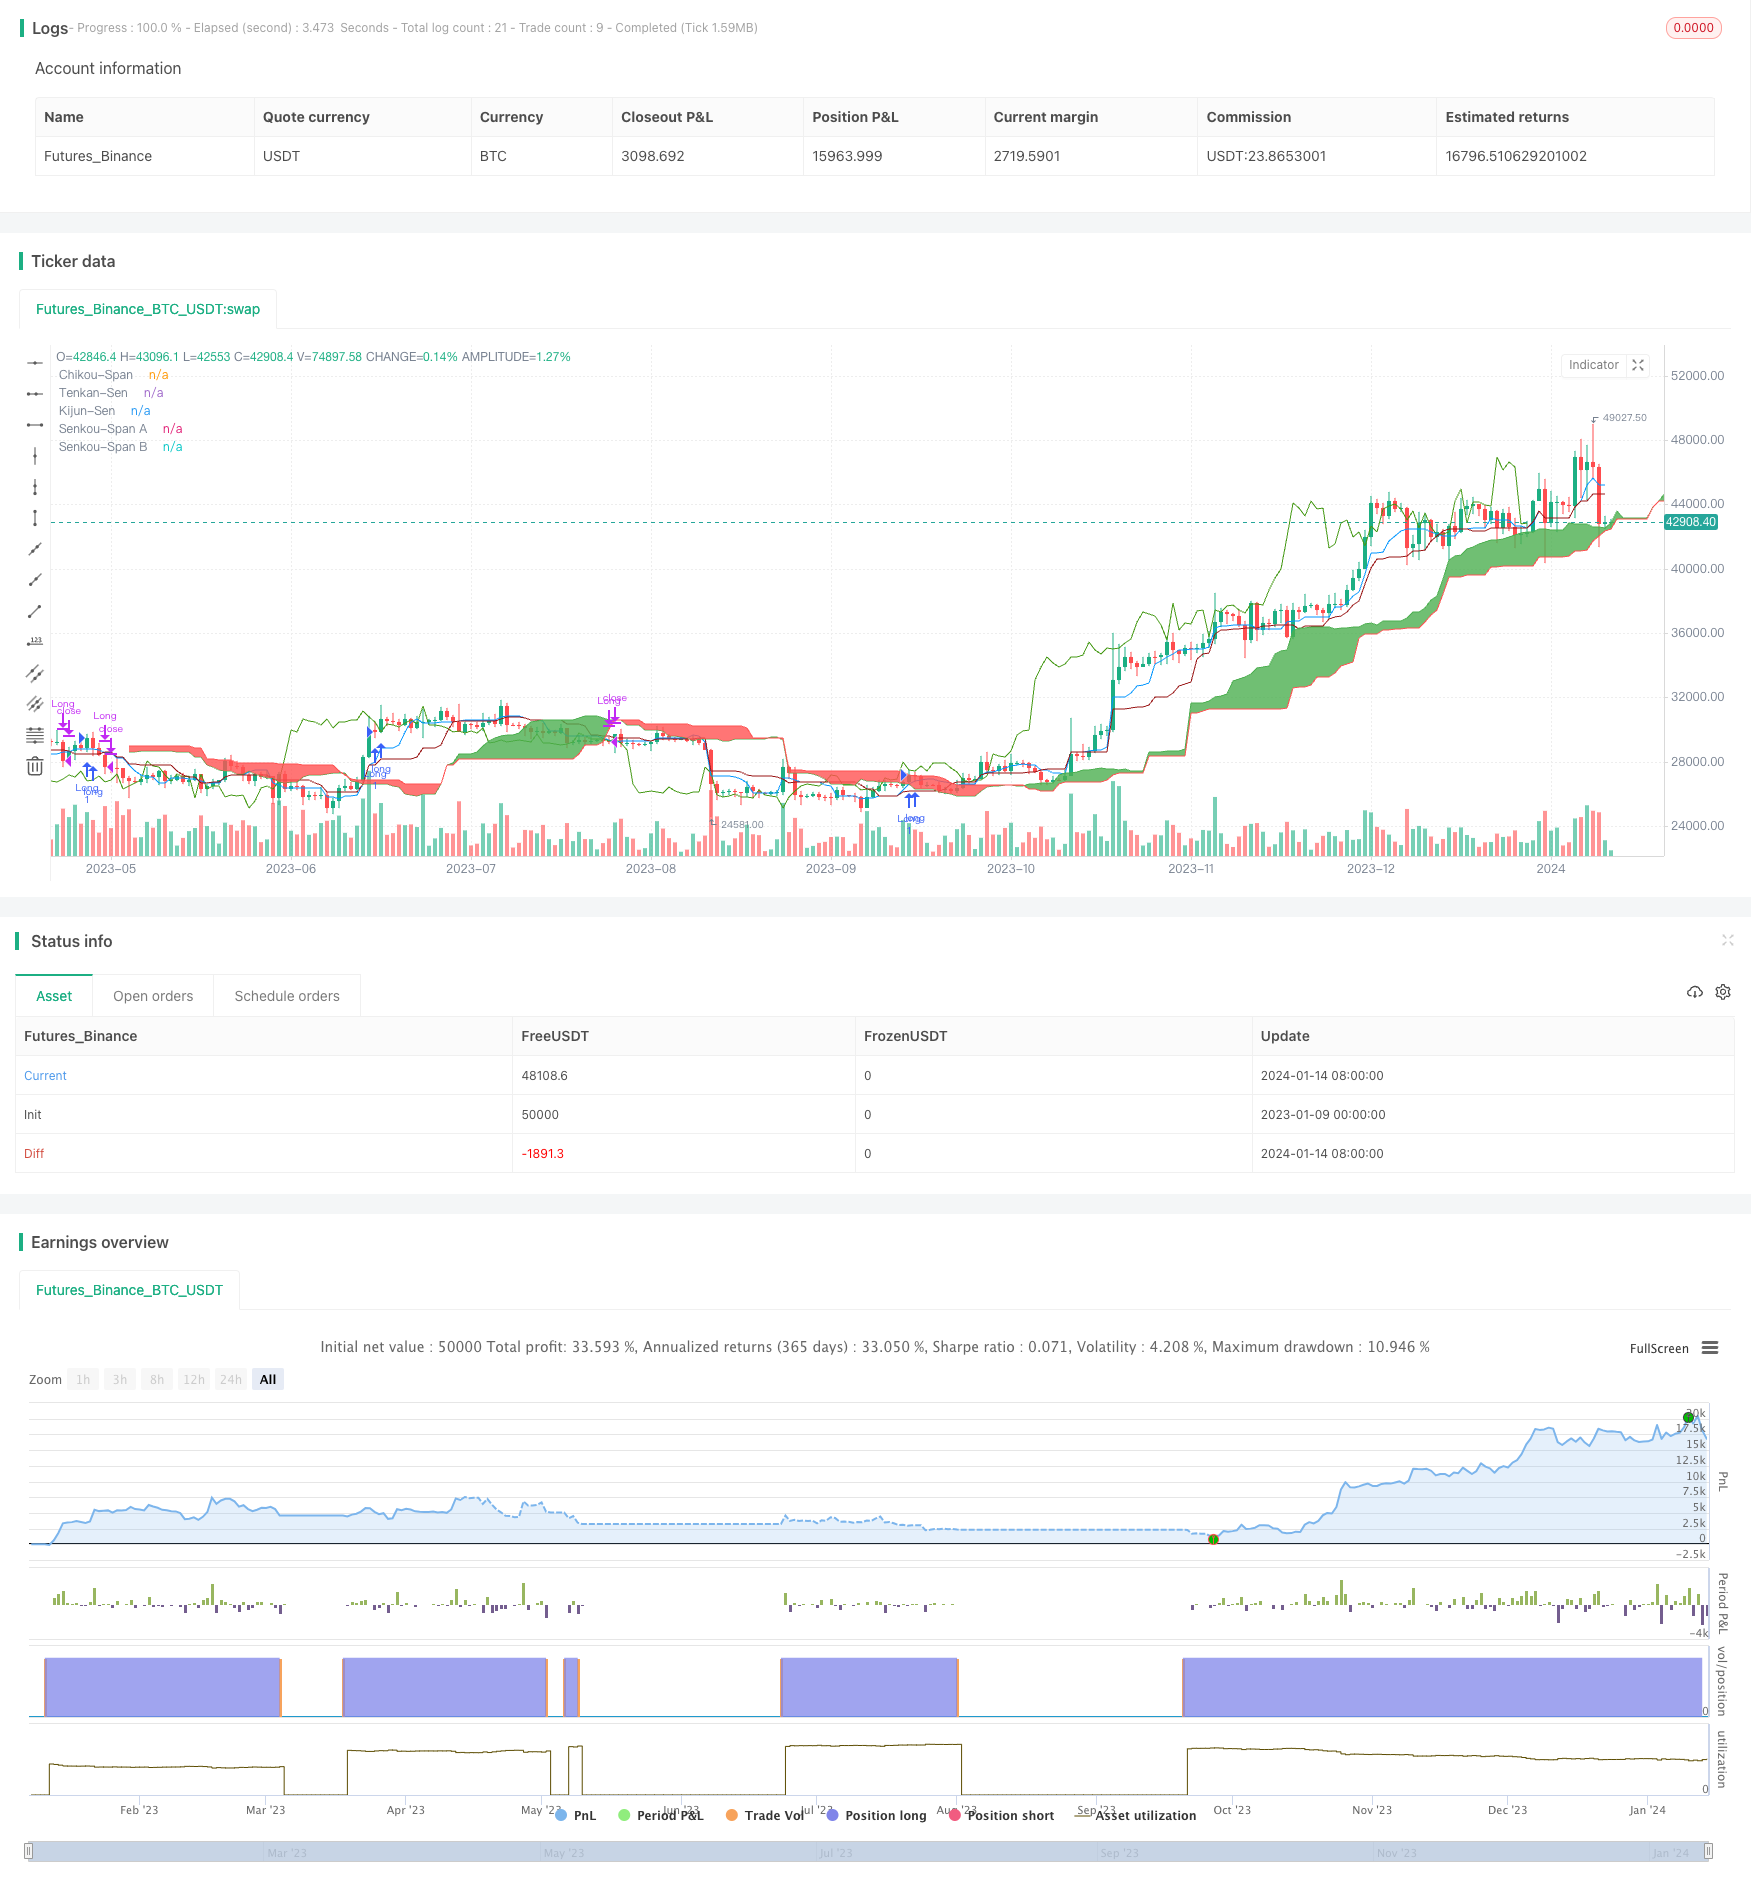
本策略名称为“基于Ichimoku Kinko Hyo指标的多空双向突破策略”。该策略运用Ichimoku Kinko Hyo指标中的变转线、基准线、先行线以及Kumo云图,判断股票的多空方向和趋势,以实现突破买入和突破卖出。
二、策略详细原理
计算Ichimoku Kinko Hyo指标的组成要素,包括:
- Tenkan-Sen(转折线):计算最高价和最低价的中间值
- Kijun-Sen(基准线):计算最高价和最低价的中间值
- Senkou Span A(先行线A):计算Tenkan-Sen和Kijun-Sen的中间值
- Senkou Span B(先行线B):计算最高价和最低价的中间值
- Chikou Span(延迟线)
判定买入信号:
- 当Tenkan-Sen上穿Kijun-Sen时;
- 且当日收盘价上穿Kumo云图时;
- 且延迟线上穿Kumo云图时,产生买入信号。
判定卖出信号:
- 当Tenkan-Sen下穿Kijun-Sen时;
- 且当日收盘价下穿Kumo云图时;
- 且延迟线下穿Kumo云图时,产生卖出信号。
三、策略优势分析
- 运用Ichimoku Kinko Hyo指标判断趋势,准确率较高。
- 延迟线的加入避免了假突破的发生。
- 多空双向交易,可在市场上涨和下跌中都获得收益。
- 参数可调整,适应不同周期。
四、策略风险分析
- 市场震荡时,可能出现频繁交易亏损。
- 需要同时满足多个条件判定信号,可能错过最佳入场点。
- 高换手费率,长期交易成本较高。
风险解决方法
- 调整参数,避免震荡市频繁交易。
- 结合其他指标确认信号,降低错误率。
- 适当延长持仓周期,降低换手费率。
五、策略优化方向
- 结合移动平均线等指标确认交易信号。
- 加入止损逻辑,降低单笔亏损。
- 优化参数,使之对不同周期和品种适应性更强。
六、策略总结
本策略通过Ichimoku Kinko Hyo多指标组合判断股票趋势,并以价格和云图的突破为交易信号,实现了多空双向交易。相比单一指标,本策略判断准确度更高,避免了许多假突破。同时也存在一定程度上的滞后,无法抓住最佳买入时点的问题。总体而言,该策略准确判定趋势方向的能力较强,风险也在可控范围,值得进一步优化和验证。
策略源码
/*backtest
start: 2023-01-09 00:00:00
end: 2024-01-15 00:00:00
period: 1d
basePeriod: 1h
exchanges: [{"eid":"Futures_Binance","currency":"BTC_USDT"}]
*/

//@version=5
strategy('Ichimoku Kinko Hyo: Basic Strategy', overlay=true)

//Inputs
ts_bars = input.int(7, minval=1, title='Tenkan-Sen Bars')
ks_bars = input.int(14, minval=1, title='Kijun-Sen Bars')
ssb_bars = input.int(28, minval=1, title='Senkou-Span B Bars')
cs_offset = input.int(14, minval=1, title='Chikou-Span Offset')
ss_offset = input.int(14, minval=1, title='Senkou-Span Offset')
long_entry = input(true, title='Long Entry')
short_entry = input(false, title='Short Entry')

middle(len) =>
    math.avg(ta.lowest(len), ta.highest(len))

// Ichimoku Components
tenkan = middle(ts_bars)
kijun = middle(ks_bars)
senkouA = math.avg(tenkan, kijun)
senkouB = middle(ssb_bars)

// Plot Ichimoku Kinko Hyo
plot(tenkan, color=color.new(#0496ff, 0), title='Tenkan-Sen')
plot(kijun, color=color.new(#991515, 0), title='Kijun-Sen')
plot(close, offset=-cs_offset + 1, color=color.new(#459915, 0), title='Chikou-Span')
sa = plot(senkouA, offset=ss_offset - 1, color=color.new(color.green, 0), title='Senkou-Span A')
sb = plot(senkouB, offset=ss_offset - 1, color=color.new(color.red, 0), title='Senkou-Span B')
fill(sa, sb, color=senkouA > senkouB ? color.green : color.red, title='Cloud color', transp=90)

ss_high = math.max(senkouA[ss_offset - 1], senkouB[ss_offset - 1])
ss_low = math.min(senkouA[ss_offset - 1], senkouB[ss_offset - 1])

// Entry/Exit Signals
tk_cross_bull = tenkan > kijun
tk_cross_bear = tenkan < kijun
cs_cross_bull = ta.mom(close, cs_offset - 1) > 0
cs_cross_bear = ta.mom(close, cs_offset - 1) < 0
price_above_kumo = close > ss_high
price_below_kumo = close < ss_low

bullish = tk_cross_bull and cs_cross_bull and price_above_kumo
bearish = tk_cross_bear and cs_cross_bear and price_below_kumo

strategy.entry('Long', strategy.long, when=bullish and long_entry)
strategy.entry('Short', strategy.short, when=bearish and short_entry)

strategy.close('Long', when=bearish and not short_entry)
strategy.close('Short', when=bullish and not long_entry)