Combination Trading Strategy Based on Dual EMA and Bandpass Filter

Overview
This strategy combines the Dual Exponential Moving Average (DEMA) and Bandpass Filter (BPF) indicators to implement breakout buying and overbought-oversold dual filtering, forming stable trading signals and pursuing maximum profitability.
Strategy Principle
The strategy consists of two sub-strategies:
-
DEMA Strategy
It uses the 2-day and 20-day dual exponential moving averages to generate golden cross buying and dead cross selling signals. This indicator filters out some price noise and helps discover trends.
-
BPF Strategy
The BPF indicator combines mathematical transforms to detect the cyclical components in prices and forms overbought-oversold zones within a certain period to generate trading signals. This strategy sets it to a 20-day cycle with a 0.5 regularization parameter.
Combining the two provides stronger verification of trend and cyclical factors when concurrent buy/sell signals emerge. Hence the reliability is higher, resulting in more stable entry and exit points.
Advantage Analysis
The biggest advantage of this strategy is the dual indicator filtering that makes the signals more stable and reliable. DEMA smoothes prices and identifies trend directions; BPF recognizes cyclical features and determines overbought-oversold zones. Cross validation between the two can greatly reduce false signals caused by price noise and cyclical adjustments.
In addition, the strategy itself has an infrequent trading frequency, avoiding excessive capital and commission costs from overtrading. Position holding times are mostly mid-to-long term, which helps avoid random fluctuation impacts.
Risk Analysis
The biggest risk of this strategy is misjudging market states. It is prone to wrong signals in ranging markets and could suffer large stop losses when trends reverse. Moreover, parameter settings could also considerably impact strategy performance.
To address these risks, methods like optimizing indicator parameters, setting stop losses/takes profits, combining other indicators etc. can be adopted for control and improvements. When judging the market has entered an ranging, choppy stage, consider suspending the strategy to avoid interference from unfavorable market conditions.
Optimization Directions
The strategy can be optimized in the following aspects:
-
Time cycle optimization. Test different DEMA and BPF parameter settings to determine the optimal period combinations.
-
Add stop loss/take profit settings. Reasonably set stop loss amplitudes to avoid loss magnification; take profits appropriately to lock in partial gains.
-
Add other indicator filters. Such as Volume, MACD etc. to avoid misleading signals from high volume unwinding and position flipping.
-
Parameter adaptive optimization. Make the DEMA and BPF parameters adaptable based on latest market conditions to keep indicator timeliness.
Conclusion
The strategy integrates the strengths of dual EMA and BPF indicators with dual filtering to improve signal quality and pursue steady mid-to-long term profits. Risks mainly come from market condition misjudgements and inadequate parameter tuning. Methods like multi-indicator validation and dynamic parameter optimization can make the strategy more elastic and adaptive for higher cost-effectiveness.
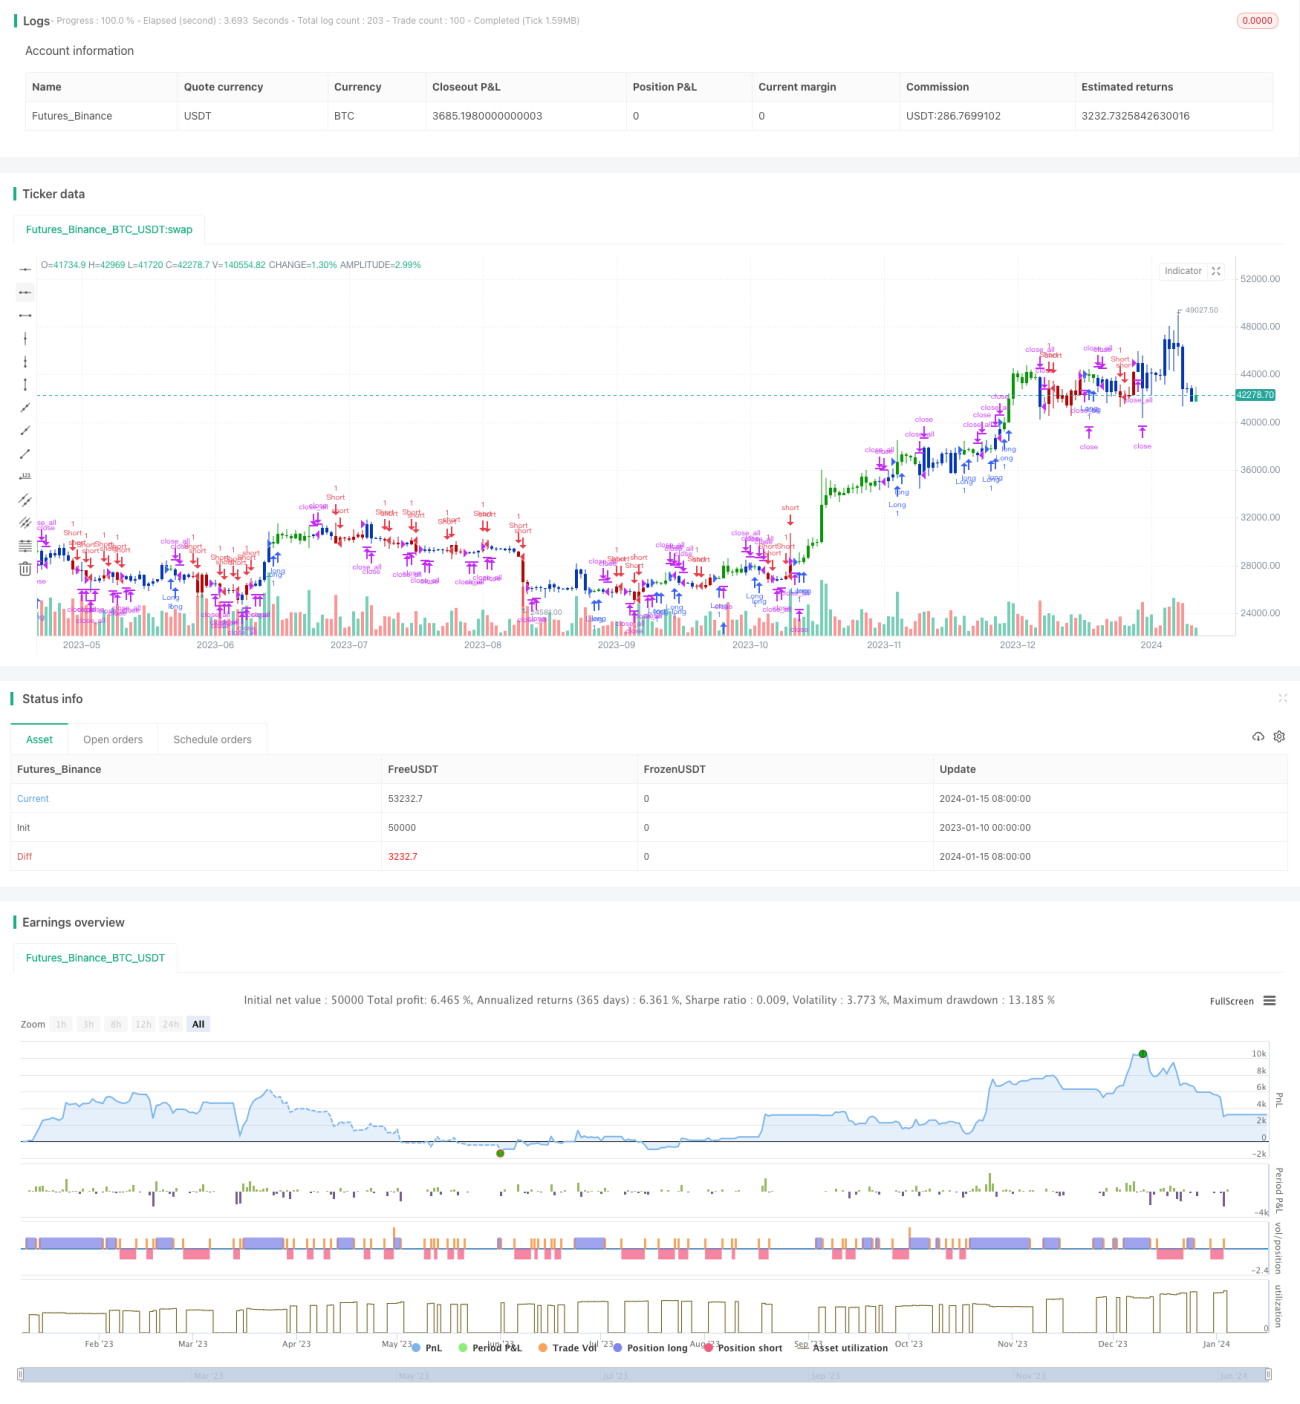
/*backtest
start: 2023-01-10 00:00:00
end: 2024-01-16 00:00:00
period: 1d
basePeriod: 1h
exchanges: [{"eid":"Futures_Binance","currency":"BTC_USDT"}]
*/

//@version=5
////////////////////////////////////////////////////////////
//  Copyright by HPotter v1.0 05/04/2022
// This is combo strategies for get a cumulative signal. - 1