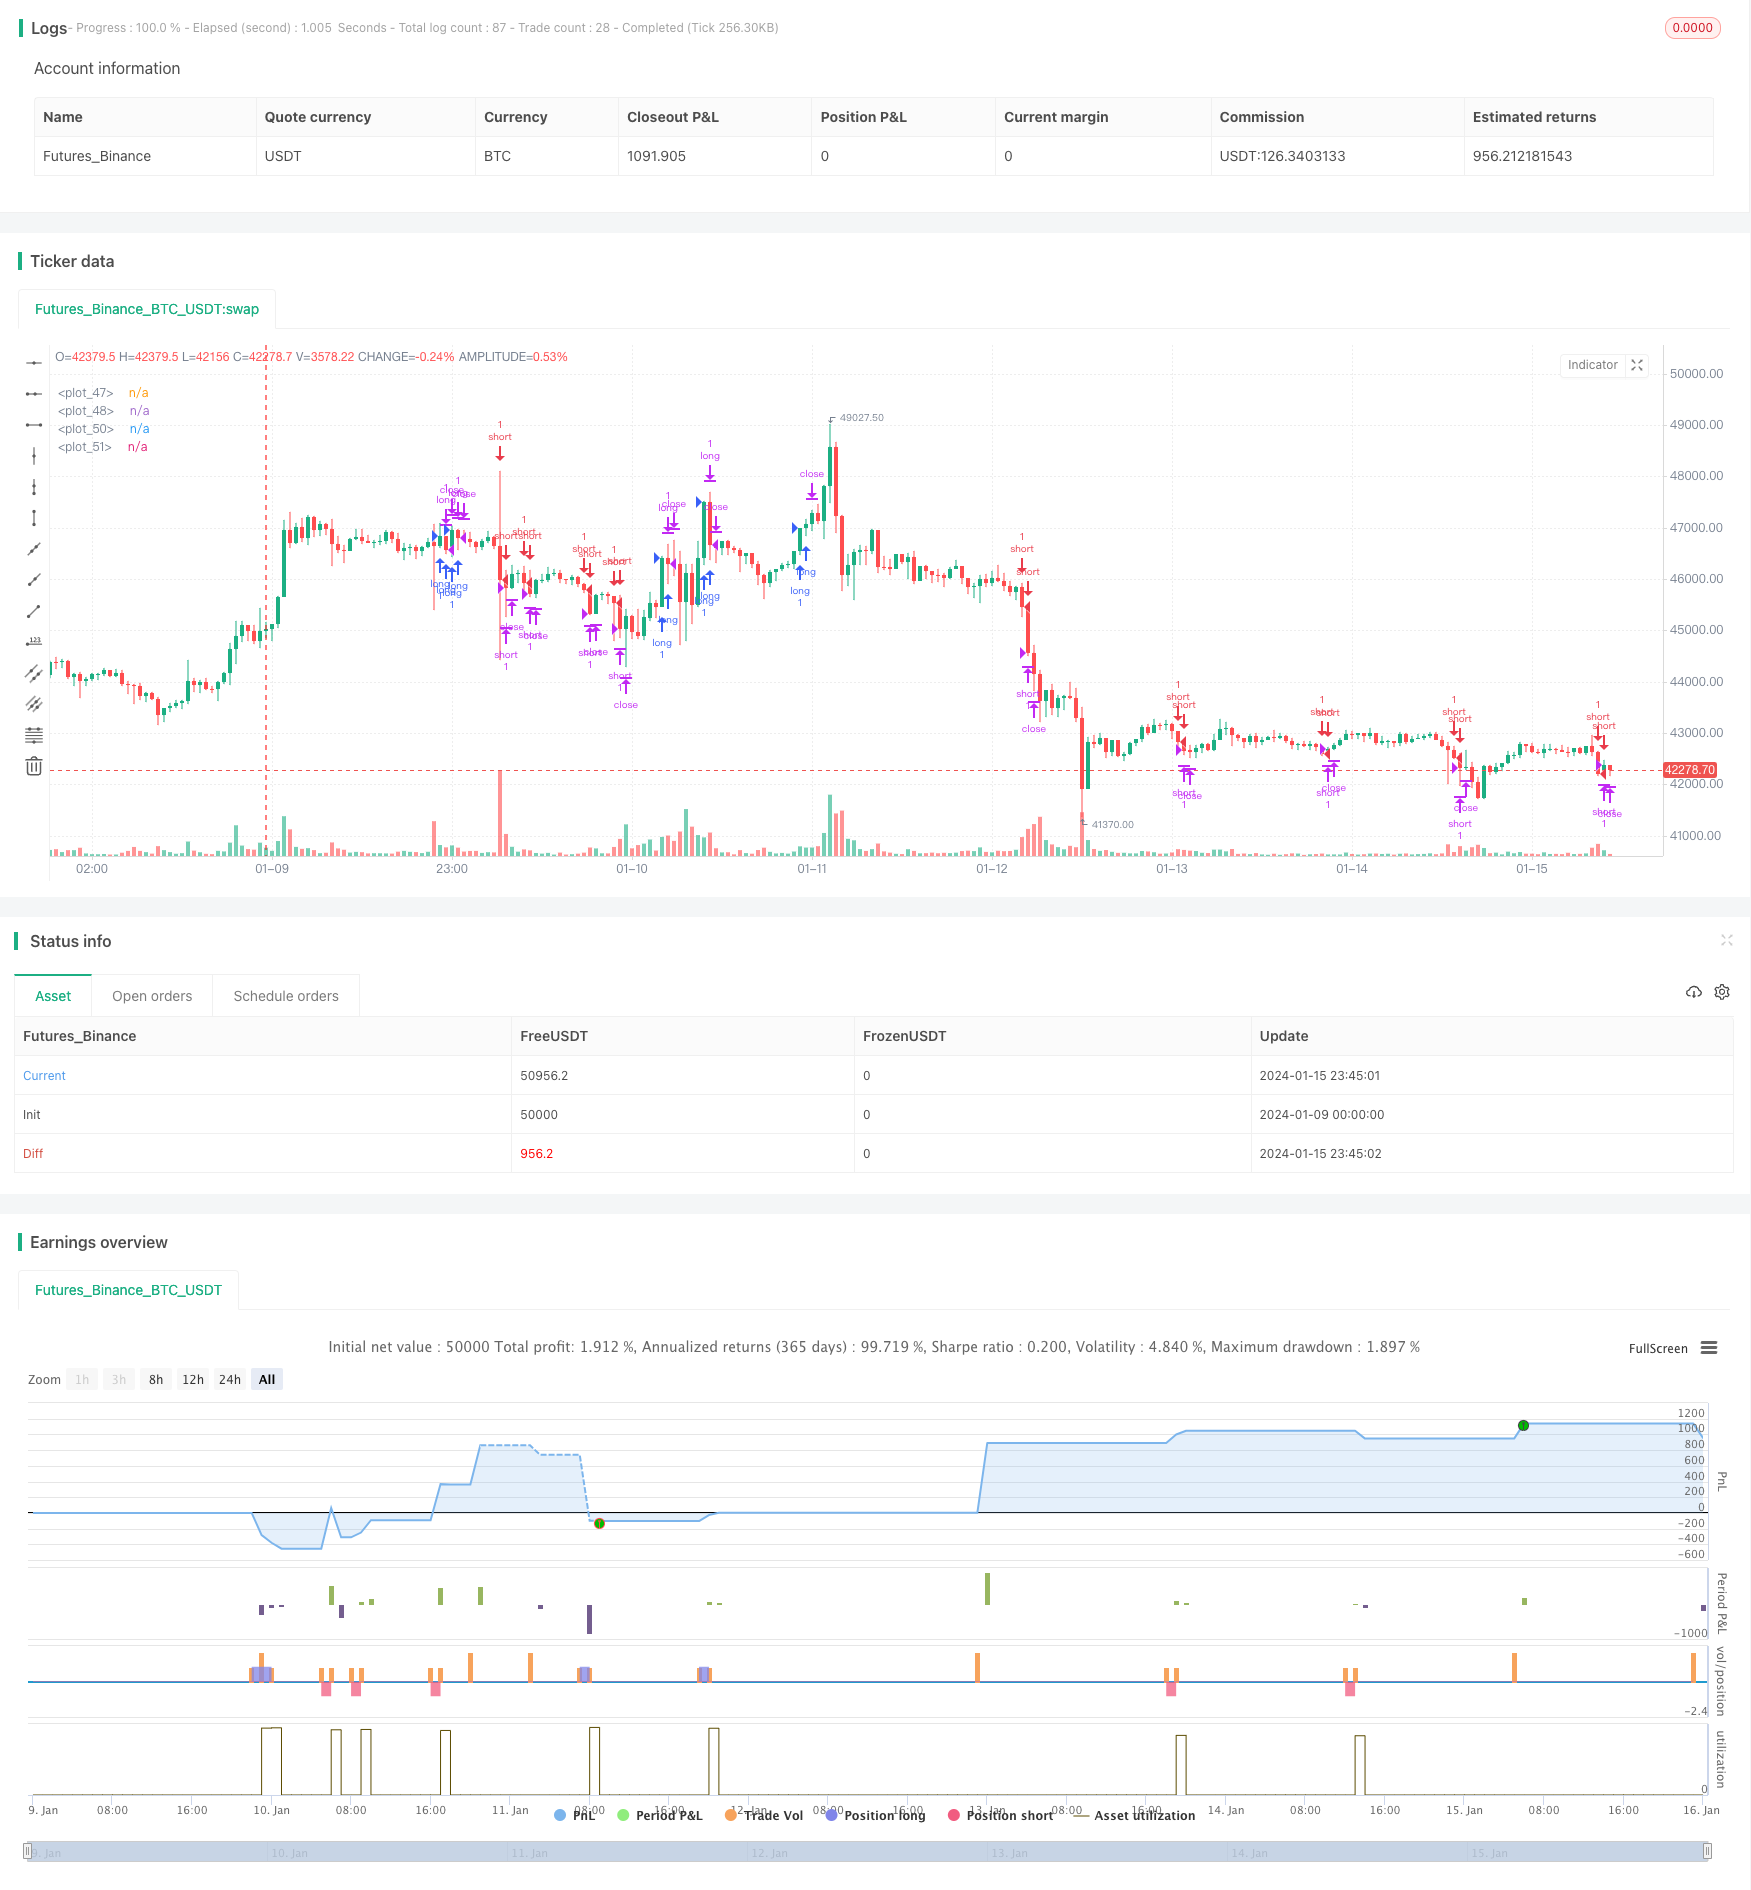
概述
本策略利用RSI指标生成买入和卖出信号,结合追踪止盈止损机制,实现盈利固定和亏损控制的目的。该策略适用于中短期交易,具有灵活、实用的特点。
策略原理
使用RSI指标判断市场超买超卖现象。当RSI指标上穿60时产生买入信号,下穿40时产生卖出信号。
进场后设置追踪止盈止损。止盈距离为入场价加上用户设置的点数距离,止损距离为入场价减去用户设置的点数距离。
当价格触及止盈或止损距离时,交易自动止盈或止损出场。
优势分析
RSI指标判断市场趋势的效果较好,结合追踪止损止盈,可以有效控制风险。
止盈止损距离是绝对点数设置,无论入场价格高低,盈利空间和亏损空间是固定的,风险收益比例可控。
策略参数设置简单,用户只需要根据自己的风险偏好设置止盈止损的点数距离即可,无须复杂优化。
风险分析
RSI指标可能产生错误信号,从而导致不必要的亏损。可通过调整RSI参数或增加其他指标过滤来减少错误信号。
固定的止盈止损距离可能导致盈利空间不足或亏损过大。用户需要根据市场波动程度合理设置止盈止损距离。
追踪止损在极端行情中可能被突破,无法限制最大亏损。建议结合临时性止损来降低风险。
优化方向
优化RSI指标参数,寻找最佳参数组合。
增加MA等指标来过滤RSI信号,减少不必要的交易。
设置止盈止损比例而不是绝对点数,可以根据价格自动调整止盈止损距离。
添加临时止损来防止极端行情的风险。
总结
本策略使用RSI指标判断买卖时机,配合追踪止盈止损控制风险收益。策略简单实用,可根据市场和个人风险偏好调整参数。结合多指标判断和止损优化,可以进一步增强策略稳定性和盈利能力。
策略源码
/*backtest
start: 2024-01-09 00:00:00
end: 2024-01-16 00:00:00
period: 45m
basePeriod: 5m
exchanges: [{"eid":"Futures_Binance","currency":"BTC_USDT"}]
*/

// This source code is subject to the terms of the Mozilla Public License 2.0 at https://mozilla.org/MPL/2.0/
// © ChaitanyaSainkar

//@version=5
strategy("RSI TARGET & STOPLOSS",overlay = true)

// USER INPUTS

RSI_L = input.int(defval = 14, title = "RSI Length")

LONGSTOP = input.int(defval = 50, title = "STOPLOSS LONG")
LONGTARGET = input.int(defval = 100, title = "TARGET LONG")

SHORTSTOP = input.int(defval = 50, title = "STOPLOSS SHORT")
SHORTTARGET = input.int(defval = 100, title = "TARGET SHORT")

// POINTBASED TARGET & STOPLOSS

RSI = ta.rsi(close,RSI_L)

longstop = strategy.position_avg_price - LONGSTOP
longtarget = strategy.position_avg_price + LONGTARGET

shortstop = strategy.position_avg_price + SHORTSTOP
shorttarget = strategy.position_avg_price - SHORTTARGET

// LONG & SHORT SIGNALS

buy = ta.crossover(RSI,60)
short = ta.crossunder(RSI,40)

// STRATEGY FUNCTIONS

if buy
    strategy.entry("long", direction = strategy.long,comment = "LONG")

if strategy.position_size > 0
    strategy.exit("long", from_entry = "long", limit = longtarget, stop = longstop, comment_loss = "LOSS", comment_profit = "PROFIT")
if short
    strategy.entry("short", direction = strategy.short,comment = "SHORT")

if strategy.position_size < 0
    strategy.exit("short", from_entry = "short", limit = longtarget, stop = shortstop, comment_loss = "LOSS", comment_profit = "PROFIT")

// PLOTTING TARGET & STOPLOSS

plot(strategy.position_size > 0 ? longtarget : na, style = plot.style_linebr, color = color.green)
plot(strategy.position_size > 0 ? longstop : na, style = plot.style_linebr, color = color.red)

plot(strategy.position_size < 0 ? shorttarget : na, style = plot.style_linebr, color = color.green)
plot(strategy.position_size < 0 ? shortstop : na, style = plot.style_linebr, color = color.red)