概述
该策略基于移动平均线的转折点来判断行情趋势,在MA上向上转折点做多,在MA下向下转折点做空,属于典型的跟踪趋势型策略。
策略原理
该策略使用price=security(tickerid, period, close)获取收盘价作为策略分析的价格,然后通过input选择计算sma平均线或ema平均线,长度是ma1,得到第一条平均线price1。然后定义roc1为price1的一日变化率,通过阈值trendStrength1来判断平均线是不是出现明显的上扬或下跌。当roc1超过trendStrength1时,定义ma1up为true,表示均线上扬;当roc1低于负的trendStrength1时,定义ma1down为true,表示均线下跌。在均线上扬时,如果前一日是下跌的,就发出做多信号;在均线下跌时,如果前一日是上扬的,就发出做空信号。
这样,该策略就利用了移动平均线转折点来捕捉股价趋势的转变,属于典型的跟踪趋势型策略。
优势分析
该策略最大的优势在于利用了移动平均线的转折点来判断趋势,这是量化交易中一种较为成熟和可靠的技术分析方法。具体优势如下:
利用移动平均线过滤噪音, Accurately捕捉趋势转折点。移动平均线对价格进行了平滑,可以过滤掉部分噪音,使得识别趋势转折更加准确可靠。
结合变化率指标判断转折力度,避免假突破。该策略不仅检测了转折点,还设置了变化率radient的阈值,这样可以避免移动平均线上的假突破带来不必要的交易。
简单参数设置,容易掌握和回测优化。该策略只有一个移动平均线,几个参数,设置和优化都比较简单,容易让用户理解和掌握。
风险分析
该策略的主要风险在于:
跟踪趋势策略,无法预测顶底点。该策略属于跟踪趋势型策略,只能跟在趋势的后面,无法预测市场的顶底点,容易错过瞬间的反转机会。
移动平均线延迟问题。移动平均线对价格走势的反映有一定的滞后性,可能会影响识别趋势转折的及时性。
前期参数优化不当直接影响效果。该策略的参数设置如平均线期数、变化率radient阈值,都会直接影响策略的盈利回撤水平,需要谨慎测试和优化。
对应解决方法是:
可以适当结合其他指标预测大级别的 熊市顶部和牛市底部。
测试EMA等响应速度更快的平均线替代SMA。
建议多组合优化寻找最佳参数设置。
优化方向
该策略可以从以下几个方向进行进一步优化:
增加第二条移动平均线形成金叉死叉策略。这样可以利用双均线之间的关系来判断趋势和过滤噪音。
加入成交量的分析。通过观察成交量在均线转折点处的变化,可以进一步验证转折点的可靠性。
测试RSI、MACD等其他技术指标的辅助作用。这些指标都可以帮助判断趋势,与均线转折形成组合策略。
多种市场条件参数优化筛选。针对牛市、熊市、震荡行情分别测试优化参数设置组合。
利用机器学习方法动态优化参数。让程序自动评估不同市场环境下参数的稳定性,实现参数的动态优化。
总结
该策略整体来说属于较为成熟的跟踪趋势型策略,有一定的实战价值。策略思路简单清晰,参数设置不多,容易理解测试。同时也存在跟踪延迟等问题。建议与其他指标组合使用,多情况测试优化,或者引入动态调整参数的机制,可以进一步增强策略的稳定性和实战效果。
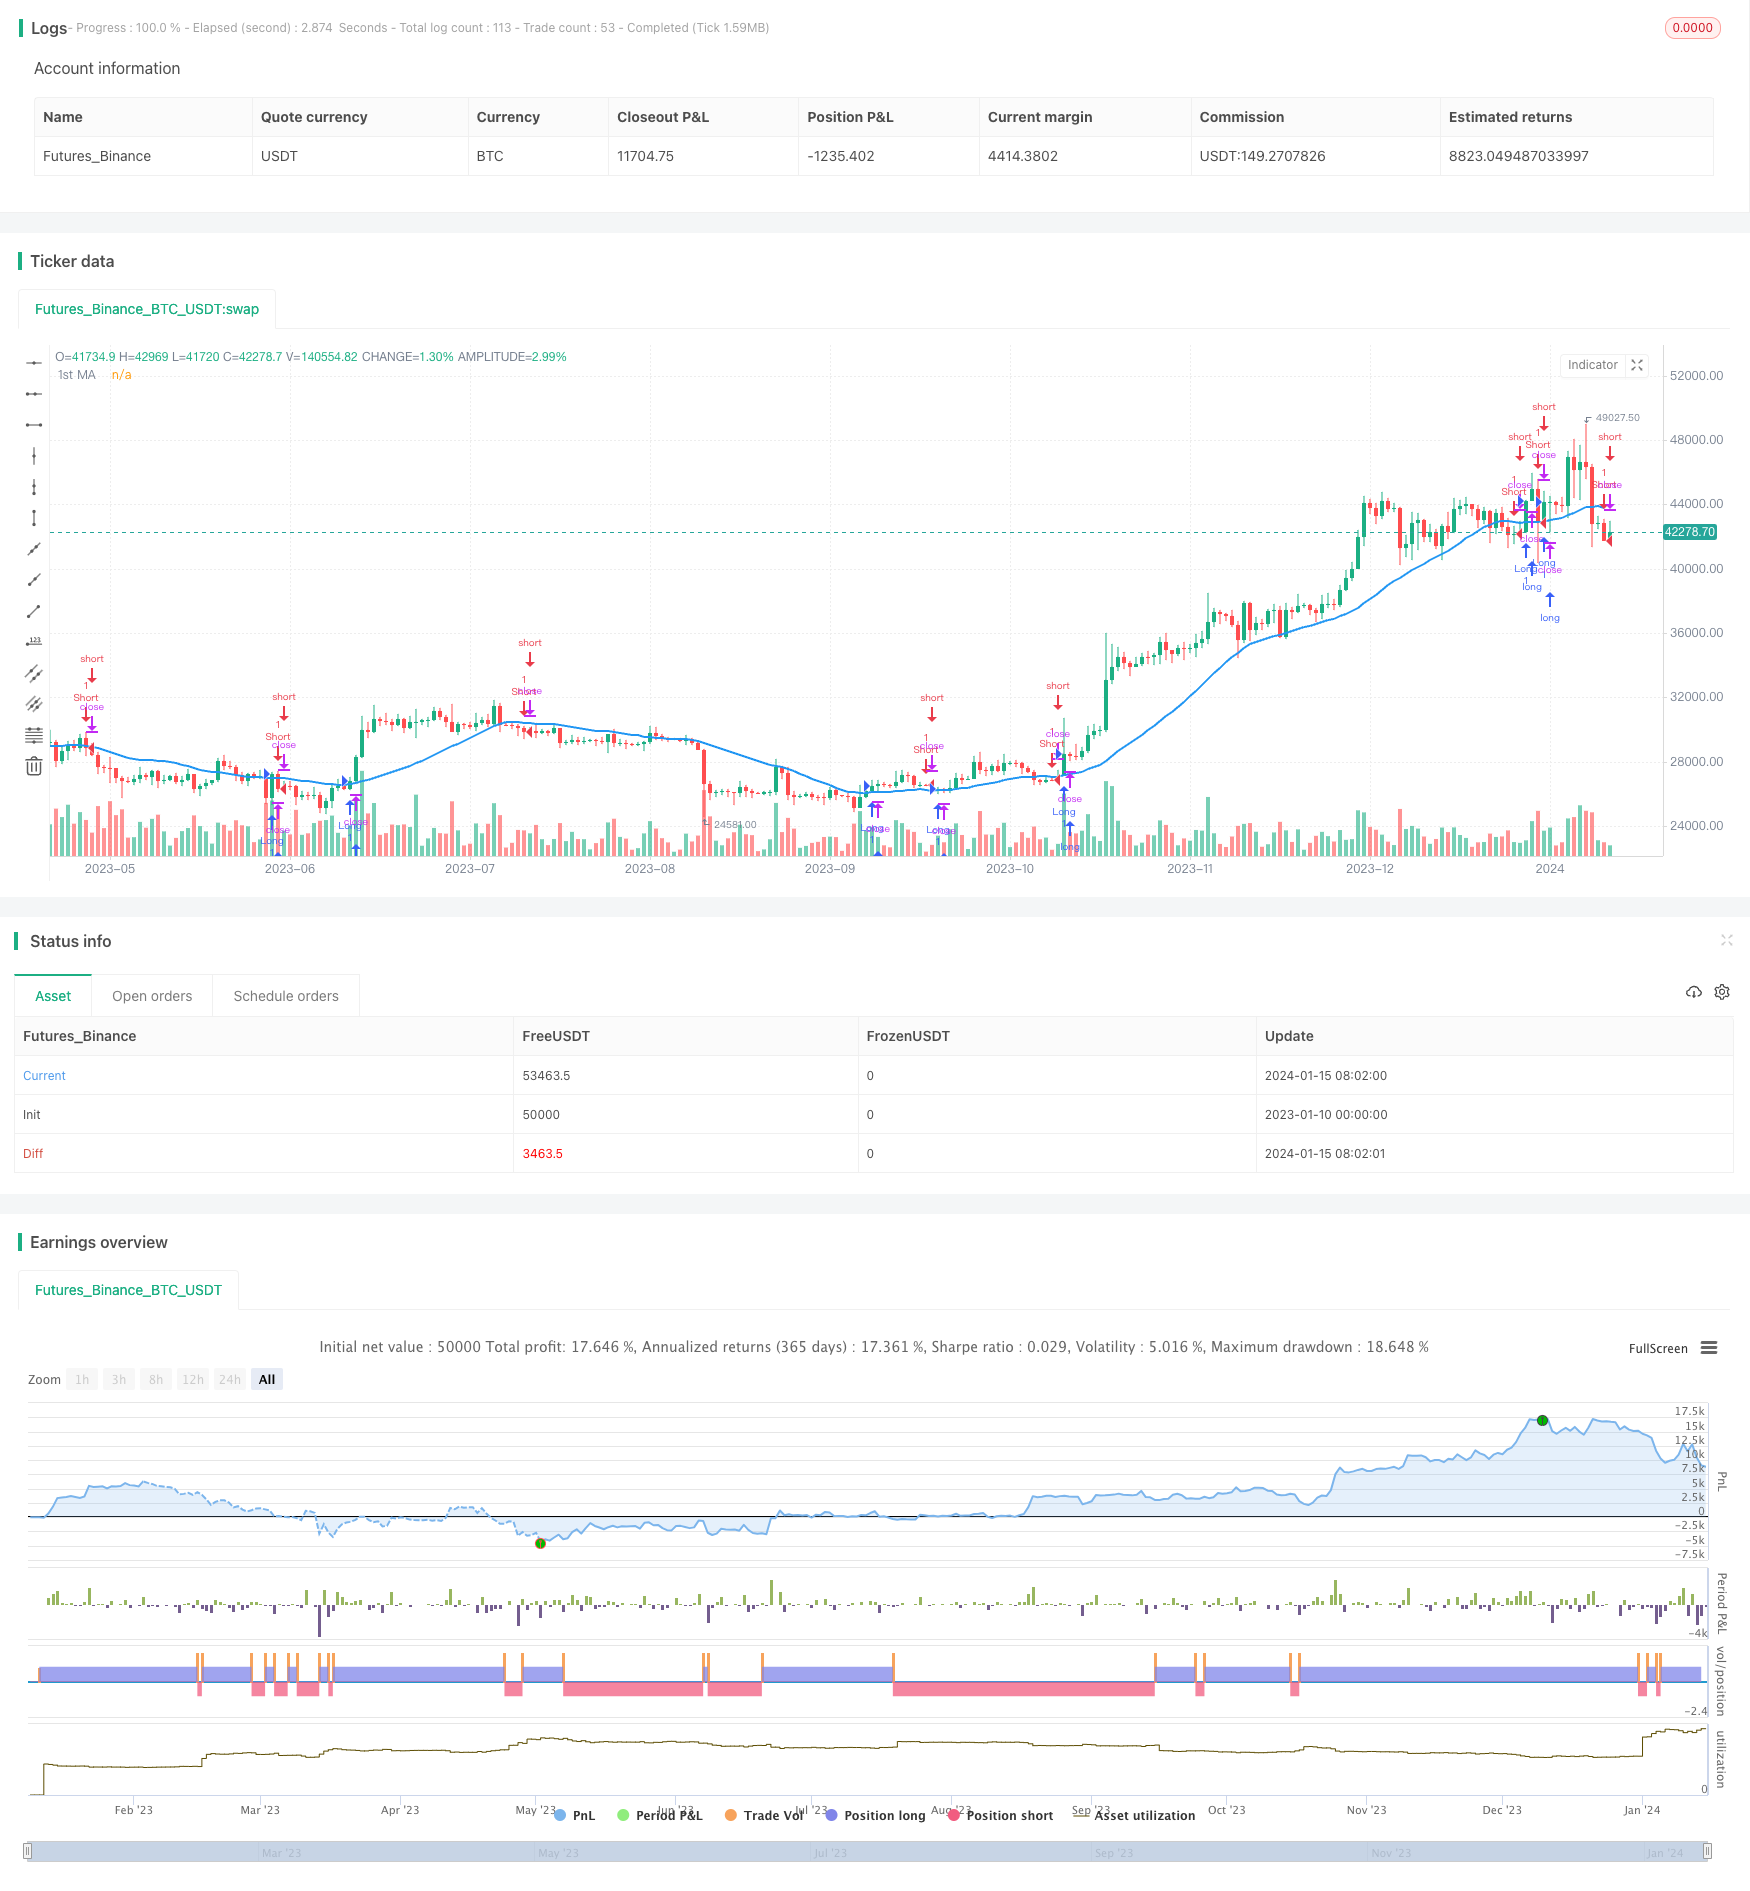
/*backtest
start: 2023-01-10 00:00:00
end: 2024-01-16 00:00:00
period: 1d
basePeriod: 1h
exchanges: [{"eid":"Futures_Binance","currency":"BTC_USDT"}]
*/

//@version=3
strategy("MA Turning Point Strategy", overlay=true)
src = input(close, title="Source")

price = request.security(syminfo.tickerid, timeframe.period, src)
ma1 = input(25, title="1st MA Length")
type1 = input("SMA", "1st MA Type", options=["SMA", "EMA"])

price1 = if (type1 == "SMA")
    sma(price, ma1)
else
    ema(price, ma1)

plot(series=price1, style=line,  title="1st MA", color=blue, linewidth=2, transp=0)

lookback1 = input(1, "Lookback 1")
roc1 = roc(price1, lookback1)

ma1up = false
ma1down = false
ma2up = false
ma2down = false

ma1up := nz(ma1up[1])
ma1down := nz(ma1down[1])
ma2up := nz(ma2up[1])
ma2down := nz(ma2down[1])

trendStrength1 = input(2.5, title="Minimum slope magnitude * 100", type=float) * 0.01

if crossover(roc1, trendStrength1)
    ma1up := true
    ma1down := false

if crossunder(roc1, -trendStrength1)
    ma1up := false
    ma1down := true

longCondition = ma1up and ma1down[1]
if (longCondition)
    strategy.entry("Long", strategy.long)

shortCondition = ma1down and ma1up[1]
if (shortCondition)
    strategy.entry("Short", strategy.short)