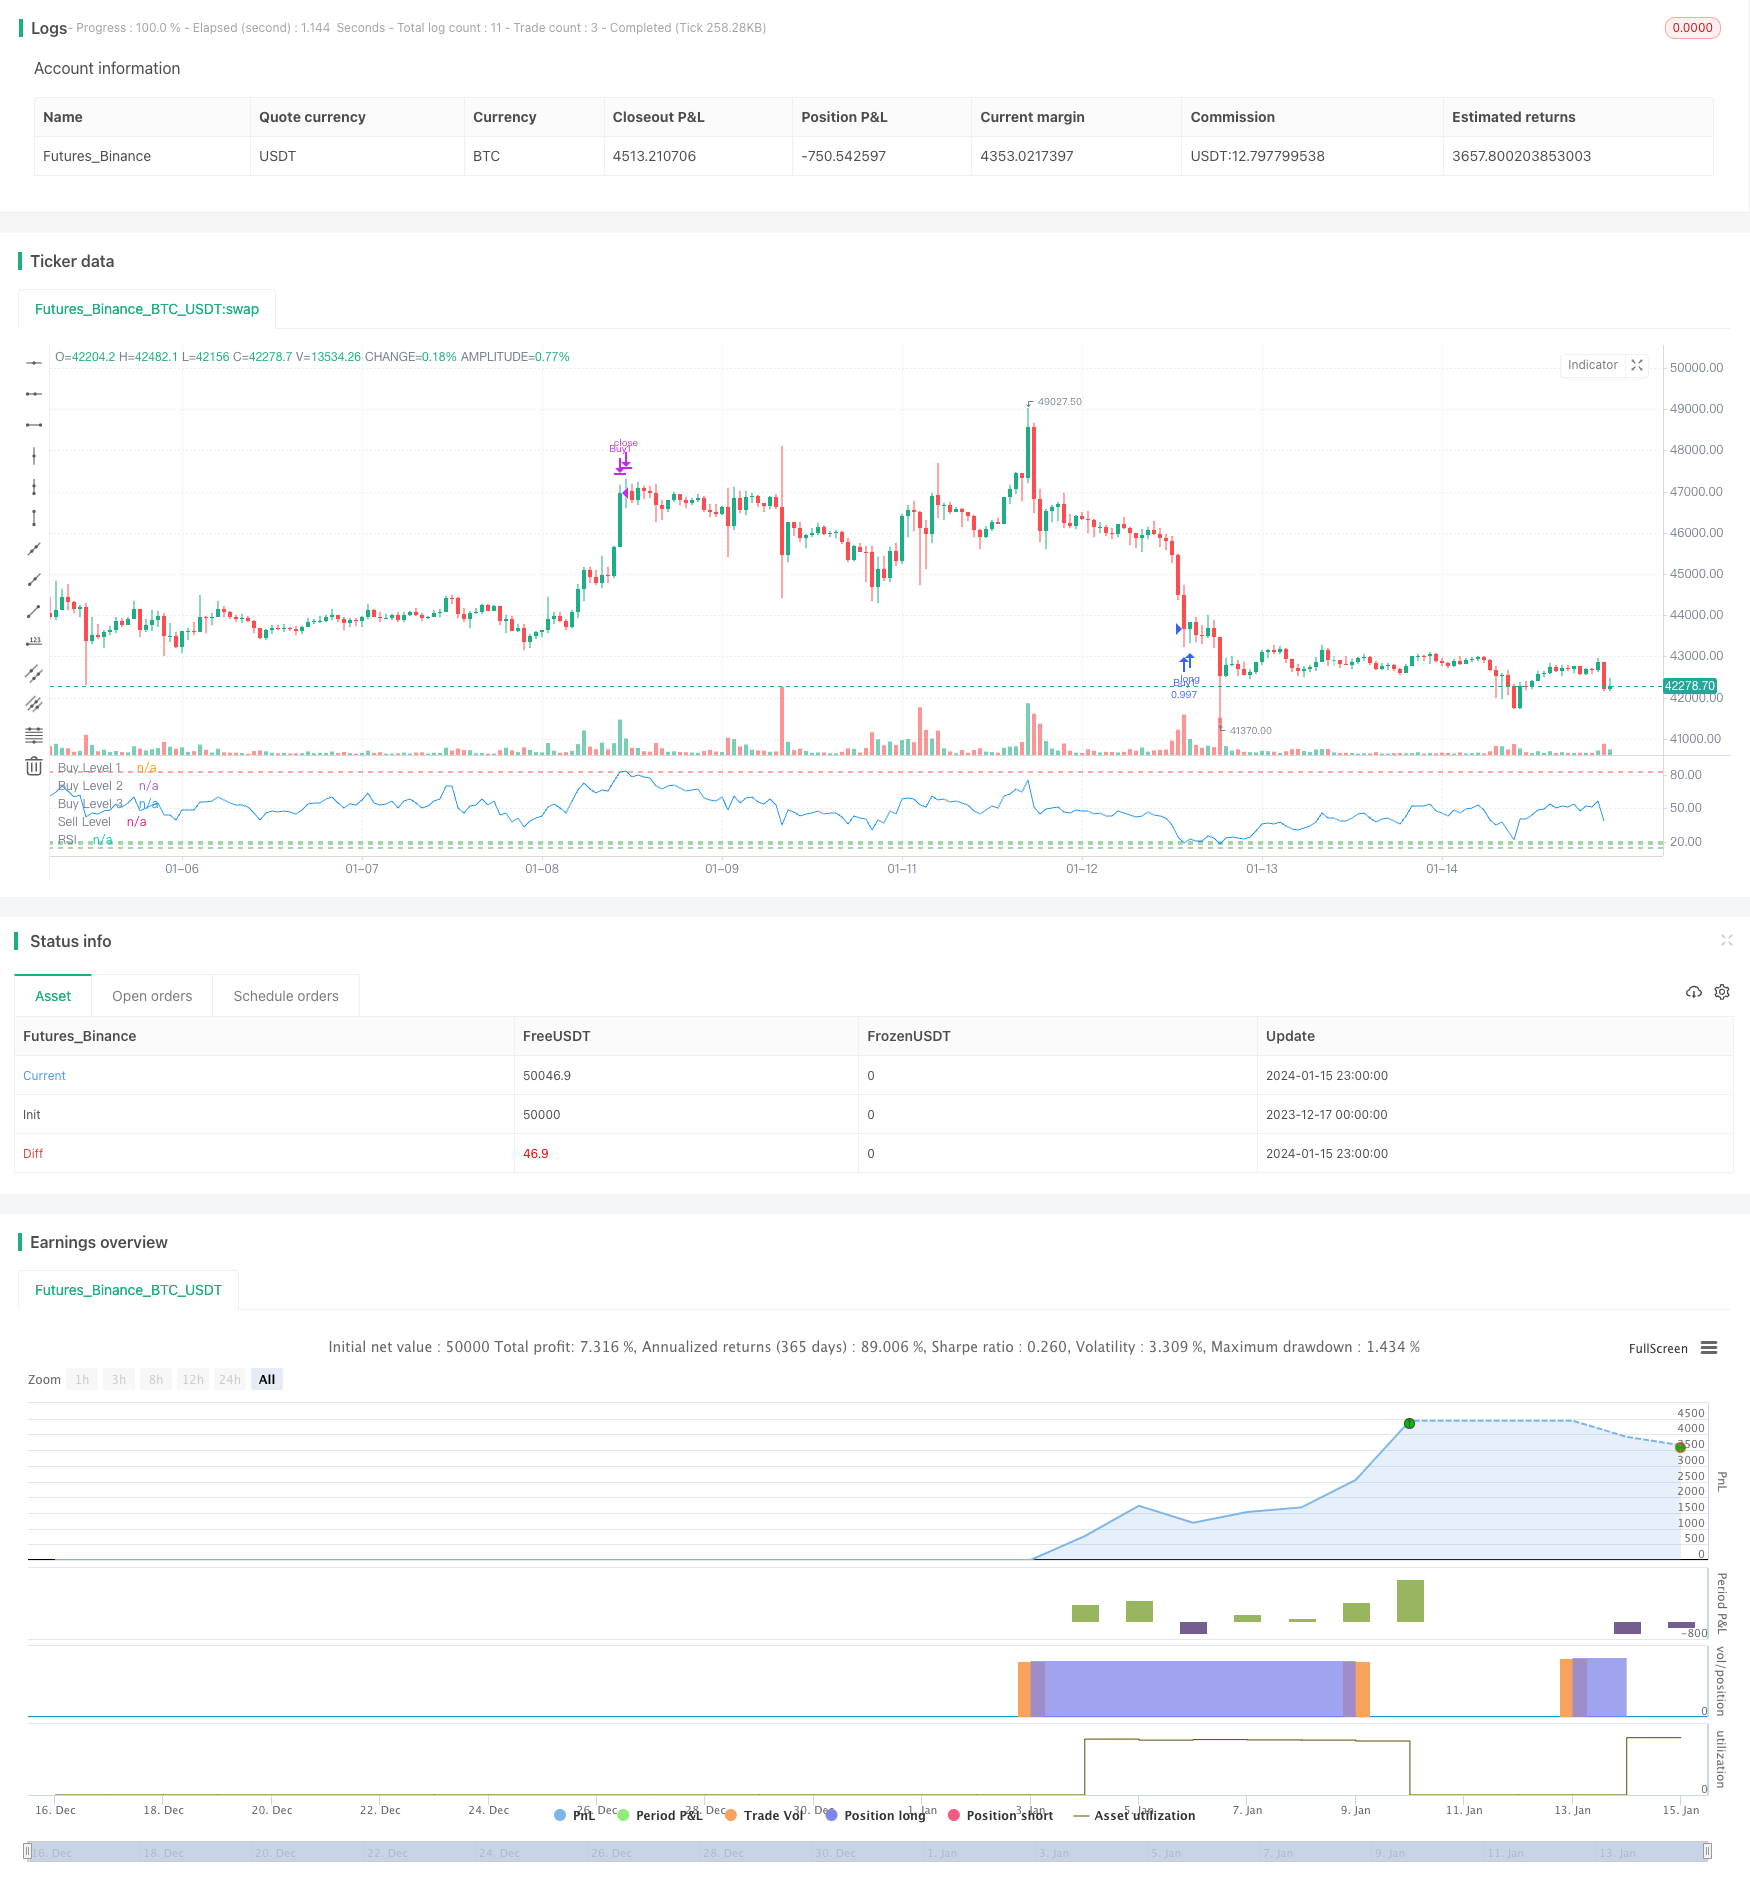
概述
该策略通过设置RSI指标的买入信号线和卖出信号线,结合移动止损来实现自动化的买入和卖出。当RSI指标低于买入信号线时发出买入信号;当RSI指标高于卖出信号线时发出卖出信号。同时设置了移动止损来锁定利润和控制风险。
策略原理
该策略主要基于RSI指标的过买过卖区域来判断买入和卖出时机。RSI指标低于20时被认为是超卖,高于80时被认为是超买。策略设置了三条RSI低位买入线,分别是20,18,14。当日收盘价高于前一日同时RSI指标低于对应的买入线时,发出买入信号。策略设置了一条RSI高位卖出线83,当RSI指标高于该卖出线时发出卖出信号。此外,策略还设置了移动止损,如果价格低于买入价格的5%,会止损卖出。
整个策略通过RSI指标的超买超卖区域判断买卖时机,并設定止损来锁定利润和控制风险,是一个典型的基于技术指标的量化交易策略。
优势分析
该策略具有以下优势:
使用了经典和广泛验证的RSI指标来判断买卖点,可以有效捕捉超买超卖的时机。
設定多条买入线,可以在不同程度低价进行分批买入,降低买入成本。
配置了移动止损来控制亏损和锁定利润,可以有效控制风险。
策略逻辑简单清晰,容易理解和修改,也容易实盘验证。
RSI指标参数可以自定义,可以针对不同品种和市场调整参数。
风险分析
该策略也存在一些风险:
单一指标策略,容易产生假信号,RSI指标发出的信号不一定准确。
不存在止盈策略,存在亏损扩大的风险。
存在超买超卖区间崩溃的风险,特别是震荡行情中。
极端行情中,价格可能直接跌破止损线,无法止损。
对应的解决方法:
结合多个指标进行判断,避免假信号。
增加 zones 或sar等止盈策略。
调整 RSI 参数,缩小区间。
4.动态止损或及时人工干预。
优化方向
该策略可以从以下几个方向进行优化:
结合其他指标,形成指标组合,避免假信号。常见的组合有:RSI + KDJ、RSI + MACD 等。
增加止盈策略,如趋势跟踪止盈、定时止盈、移动止盈通道等。
参数优化,针对不同品种、周期调整 RSI 参数。
策略衍生,如断头转身策略、分批进场策略等策略组合运用。
适当缩小买卖区间,避免超买超卖假信号。
总结
该策略整体是一个典型的基于 RSI 指标通过设置买卖信号的量化交易策略。策略简单易懂,容易实盘。但存在单一指标信号不可靠,无止盈策略风险较大的缺点。我们可以通过参数优化,策略组合,增加止盈策略等手段进一步完善该策略。
/*backtest
start: 2023-12-17 00:00:00
end: 2024-01-16 00:00:00
period: 1h
basePeriod: 15m
exchanges: [{"eid":"Futures_Binance","currency":"BTC_USDT"}]
*/

//@version=5
strategy("RSI Buy/Sell Strategy", overlay=false)

// Input for RSI period
rsiPeriod = input(12, title="RSI Period")

// Input for RSI levels
rsiBuyLevel1 = 20
rsiBuyLevel2 = 18
rsiBuyLevel3 = 14
rsiSellLevel = input(83, title="RSI Sell Level")

// Input for stop loss percentage
stopLossPercent = input(5, title="Stop Percentage")

// Calculate RSI
rsiValue = ta.rsi(close, rsiPeriod)

// Buy Conditions: RSI below buy levels
buyCondition1 = close[1] > close and rsiValue <= rsiBuyLevel1
buyCondition2 = close[1] > close and rsiValue <= rsiBuyLevel2
buyCondition3 = close[1] > close and rsiValue <= rsiBuyLevel3

// Sell Conditions: RSI above sell level or stop loss
sellCondition = (rsiValue > rsiSellLevel )//or ( close[1] < close * (1 - stopLossPercent / 100))

// Calculate position size based on 10% of current equity
positionSize = strategy.equity * 0.8 / close

// Plot RSI on the chart
plot(rsiValue, title="RSI", color=color.blue)

// Plot horizontal lines for buy and sell levels
hline(rsiBuyLevel1, "Buy Level 1", color=color.green)
hline(rsiBuyLevel2, "Buy Level 2", color=color.green)
hline(rsiBuyLevel3, "Buy Level 3", color=color.green)
hline(rsiSellLevel, "Sell Level", color=color.red)

// Execute Buy and Sell orders with stop loss
strategy.entry("Buy1", strategy.long, when = buyCondition1, qty = positionSize,stop=close * stopLossPercent / 100)
strategy.entry("Buy2", strategy.long, when = buyCondition2, qty = positionSize,stop=close * stopLossPercent / 100)
strategy.entry("Buy3", strategy.long, when = buyCondition3, qty = positionSize,stop=close * stopLossPercent / 100)

strategy.close("Buy1", when = sellCondition)
strategy.close("Buy2", when = sellCondition)
strategy.close("Buy3", when = sellCondition)