概述
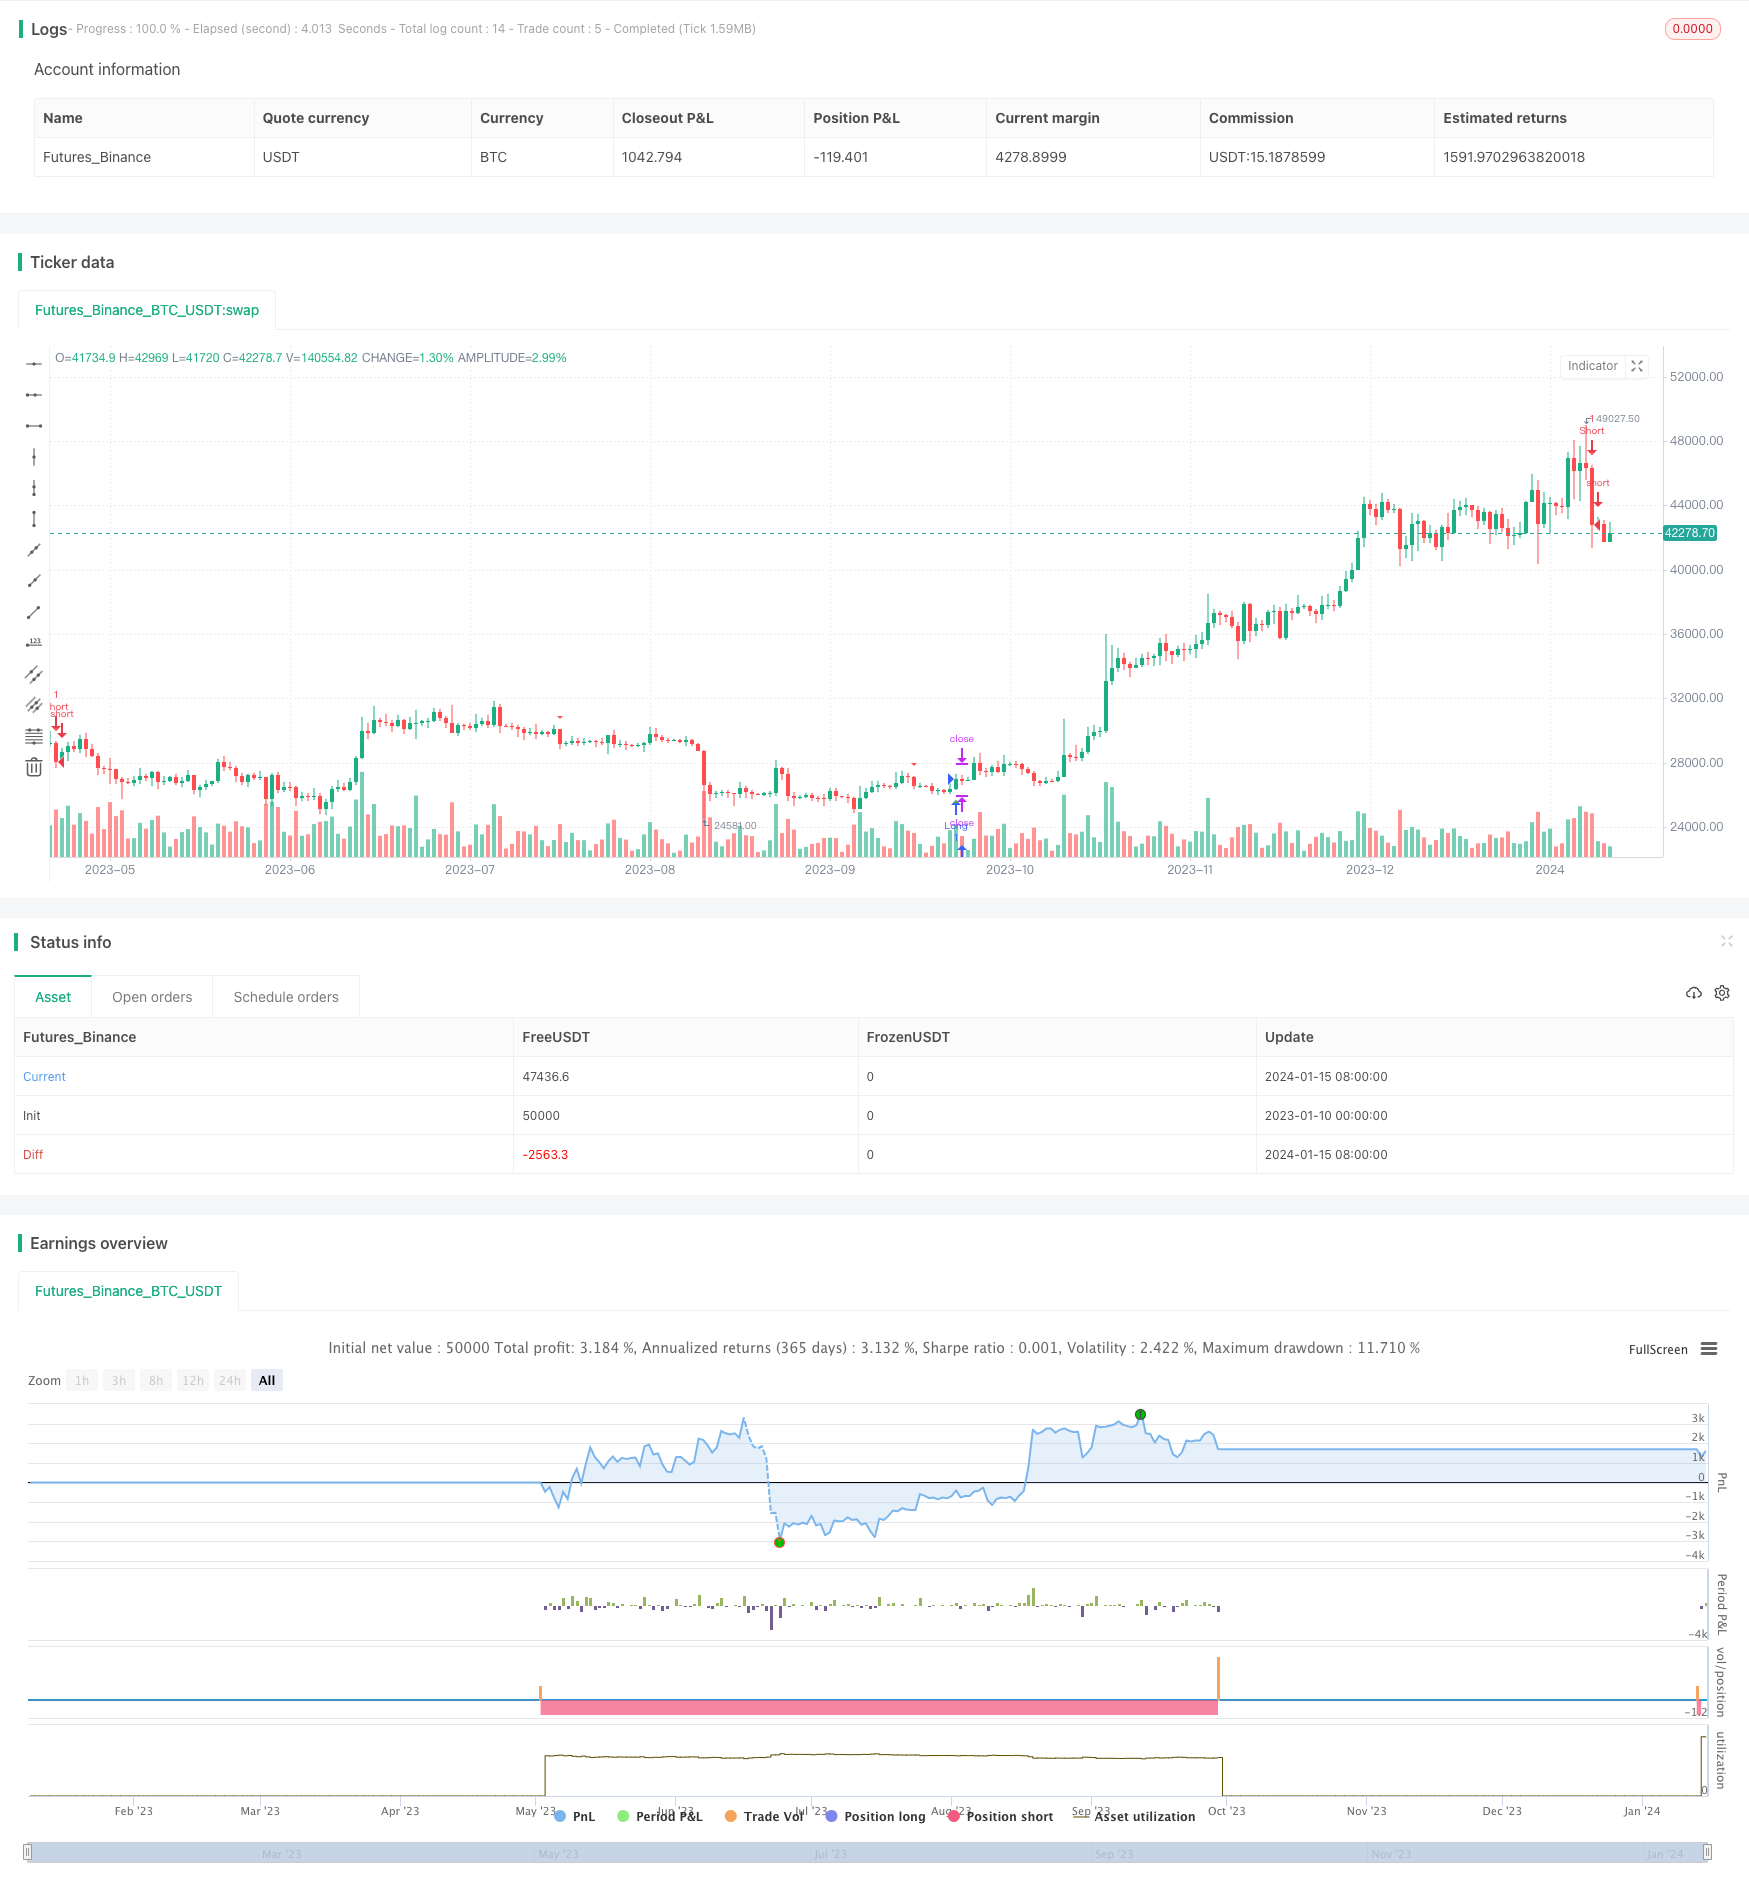
双SMA动量策略是一种基于技术分析的交易策略,它根据两个简单移动平均线(SMA)指标生成买入和卖出信号。它旨在捕捉股票的短期至中期价格动量。
策略逻辑
该策略使用两个SMA指标,即短期和长期时间窗口 - 快速SMA(长度为9个周期)和慢速SMA(长度为45个周期)。
当股票的收盘价格突破快速SMA和慢速SMA的均线时,表示开始出现上升趋势,该策略在此时生成多头/买入信号并进入多头头寸。
当价格跌破两条SMA均线时,表示开始出现下降趋势,该策略在此时生成空头/卖出信号并进入空头头寸。
止损水平动态设置为前一日的最高点(对空头交易)和前一日的最低点(对多头交易)。
优势分析
该策略的主要优势有:
- 结合使用短期和长期SMA以捕捉新出现的中期趋势
- 自适应止损位安置可降低风险并让利润继续运行
- 易于理解和实施
- 在趋势性行情中表现突出
但是,与所有技术分析策略一样,在震荡行情中信号频繁错误。可通过添加其他指标如RSI进行确证以改进。
风险分析
该策略的主要风险有:
易受震荡和错误信号影响:仅依赖于SMA交叉,在盘整或震荡行情中可能出现任性信号,带来不必要的交易成本。这可以通过与RSI等其他指标组合来缓解。
vulnerable to sudden trend reversals: 入市后快速反转可能迅速击穿止损位。可以通过优化SMA长度或添加其他过滤器来降低这种风险。
参数优化过度拟合风险: 对SMA长度和其他参数的广泛优化可能导致实盘表现差。 需要在长时间范围内进行稳健的回测。
优化方向
可以通过以下方式增强该策略:
- 添加RSI等其他指标进行额外确认以提高信号的准确性
- 使用ATR或悬空止损法等动态止损方法更好地适应市场波动
- 根据不同股票的历史波动性和交易时间范围优化SMA长度
- 添加合理的资金管理和仓位管理规则以最大化回报和限制回撤
总结
综上所述,双SMA动量策略提供了直接捕捉短期至中期趋势的方法。 尽管它的方法很基本,但添加额外过滤器、动态止损和谨慎优化可以帮助改善其风险调整回报。在股票上涨和下跌趋势中有选择地使用,它可以捕捉到可盈利的行情。
策略源码
/*backtest
start: 2023-01-10 00:00:00
end: 2024-01-16 00:00:00
period: 1d
basePeriod: 1h
exchanges: [{"eid":"Futures_Binance","currency":"BTC_USDT"}]
*/

//@version=5
strategy("SMA Crossover Strategy", overlay=true)

// Input parameters
fast_length = input(9, title="Fast SMA Length")
slow_length = input(45, title="Slow SMA Length")

// Calculate moving averages
fast_sma = ta.sma(close, fast_length)
slow_sma = ta.sma(close, slow_length)

// Buy condition
buy_condition = ta.crossover(close, fast_sma) and ta.crossover(close, slow_sma)

// Sell condition
sell_condition = ta.crossunder(close, fast_sma) and ta.crossunder(close, slow_sma)

// Calculate stop loss levels
prev_low = request.security(syminfo.tickerid, "1D", low[1], lookahead=barmerge.lookahead_on)
prev_high = request.security(syminfo.tickerid, "1D", high[1], lookahead=barmerge.lookahead_on)

// Plot signals on the chart
plotshape(buy_condition, style=shape.triangleup, location=location.belowbar, color=color.green, size=size.small)
plotshape(sell_condition, style=shape.triangledown, location=location.abovebar, color=color.red, size=size.small)

// Strategy exit conditions
long_stop_loss = sell_condition ? prev_low : na
short_stop_loss = buy_condition ? prev_high : na

strategy.exit("Long Exit", from_entry="Long", when=sell_condition, stop=long_stop_loss)
strategy.exit("Short Exit", from_entry="Short", when=buy_condition, stop=short_stop_loss)

strategy.entry("Long", strategy.long, when=buy_condition)
strategy.entry("Short", strategy.short, when=sell_condition)