概述
多重筛选型布林带交易策略是一种量化交易策略,该策略结合布林带指标、均线指标、RSI指标以及K线图形特征进行多重条件筛选,在满足条件时发出交易信号。这是一个典型的趋势跟踪策略,通过捕捉中长线的价格趋势波动来获利。
策略原理
指标计算
该策略主要使用了布林带、均线和RSI三个指标。其中,布林带中轨是价格的n日简单移动均线,上轨和下轨分别是中轨+2倍标准差和中轨-2倍标准差。RSI指标则是根据一定时期内的涨跌幅计算得到的范围在0~100之间的数值。
交易信号
该策略通过以下三个主要条件判断产生交易信号:
(1) 布林带下轨突破&K线实体背驳。当收盘价格上穿下轨,且该K线实体颜色与当前趋势方向相反时,做多。
(2) 布林带上轨突破&K线实体背驳。当收盘价格下穿上轨,且该K线实体颜色与当前趋势方向相反时,做空。
(3) K线实体转向。如果持仓方向与K线实体颜色转向一致,则平仓。
除此之外,该策略还设置了均线过滤器、K线实体过滤器、RSI过滤器等辅助条件来严格控制入场。
优势分析
- 多重条件严格控制,可减少假突破带来的风险
- 采用趋势跟踪方式,降低了交易频率
- RSI指标辅助判断可避免反转陷阱
风险分析
- 布林带参数设置不当可能导致信号较少
- 突破失败可能造成较大亏损
- 交易频率较低,可能错过部分交易机会
可以通过调整布林带参数,严格控制止损来减少风险。
优化方向
- 可以测试不同参数下的策略表现,寻找最优参数
- 可以加入机器学习算法,让策略自动优化参数
- 可以加入更多因子和过滤器来提高策略稳定性
总结
本策略整体来说是一种典型的中长线趋势跟踪策略。通过多重条件筛选,严格控制入场出场时机,采用趋势交易方式,可以减少不必要的交易,捕捉市场中长线趋势。该策略优化空间还很大,通过参数调整、加入更多辅助工具等手段可以进一步提升策略的稳定性和盈利能力。
策略源码
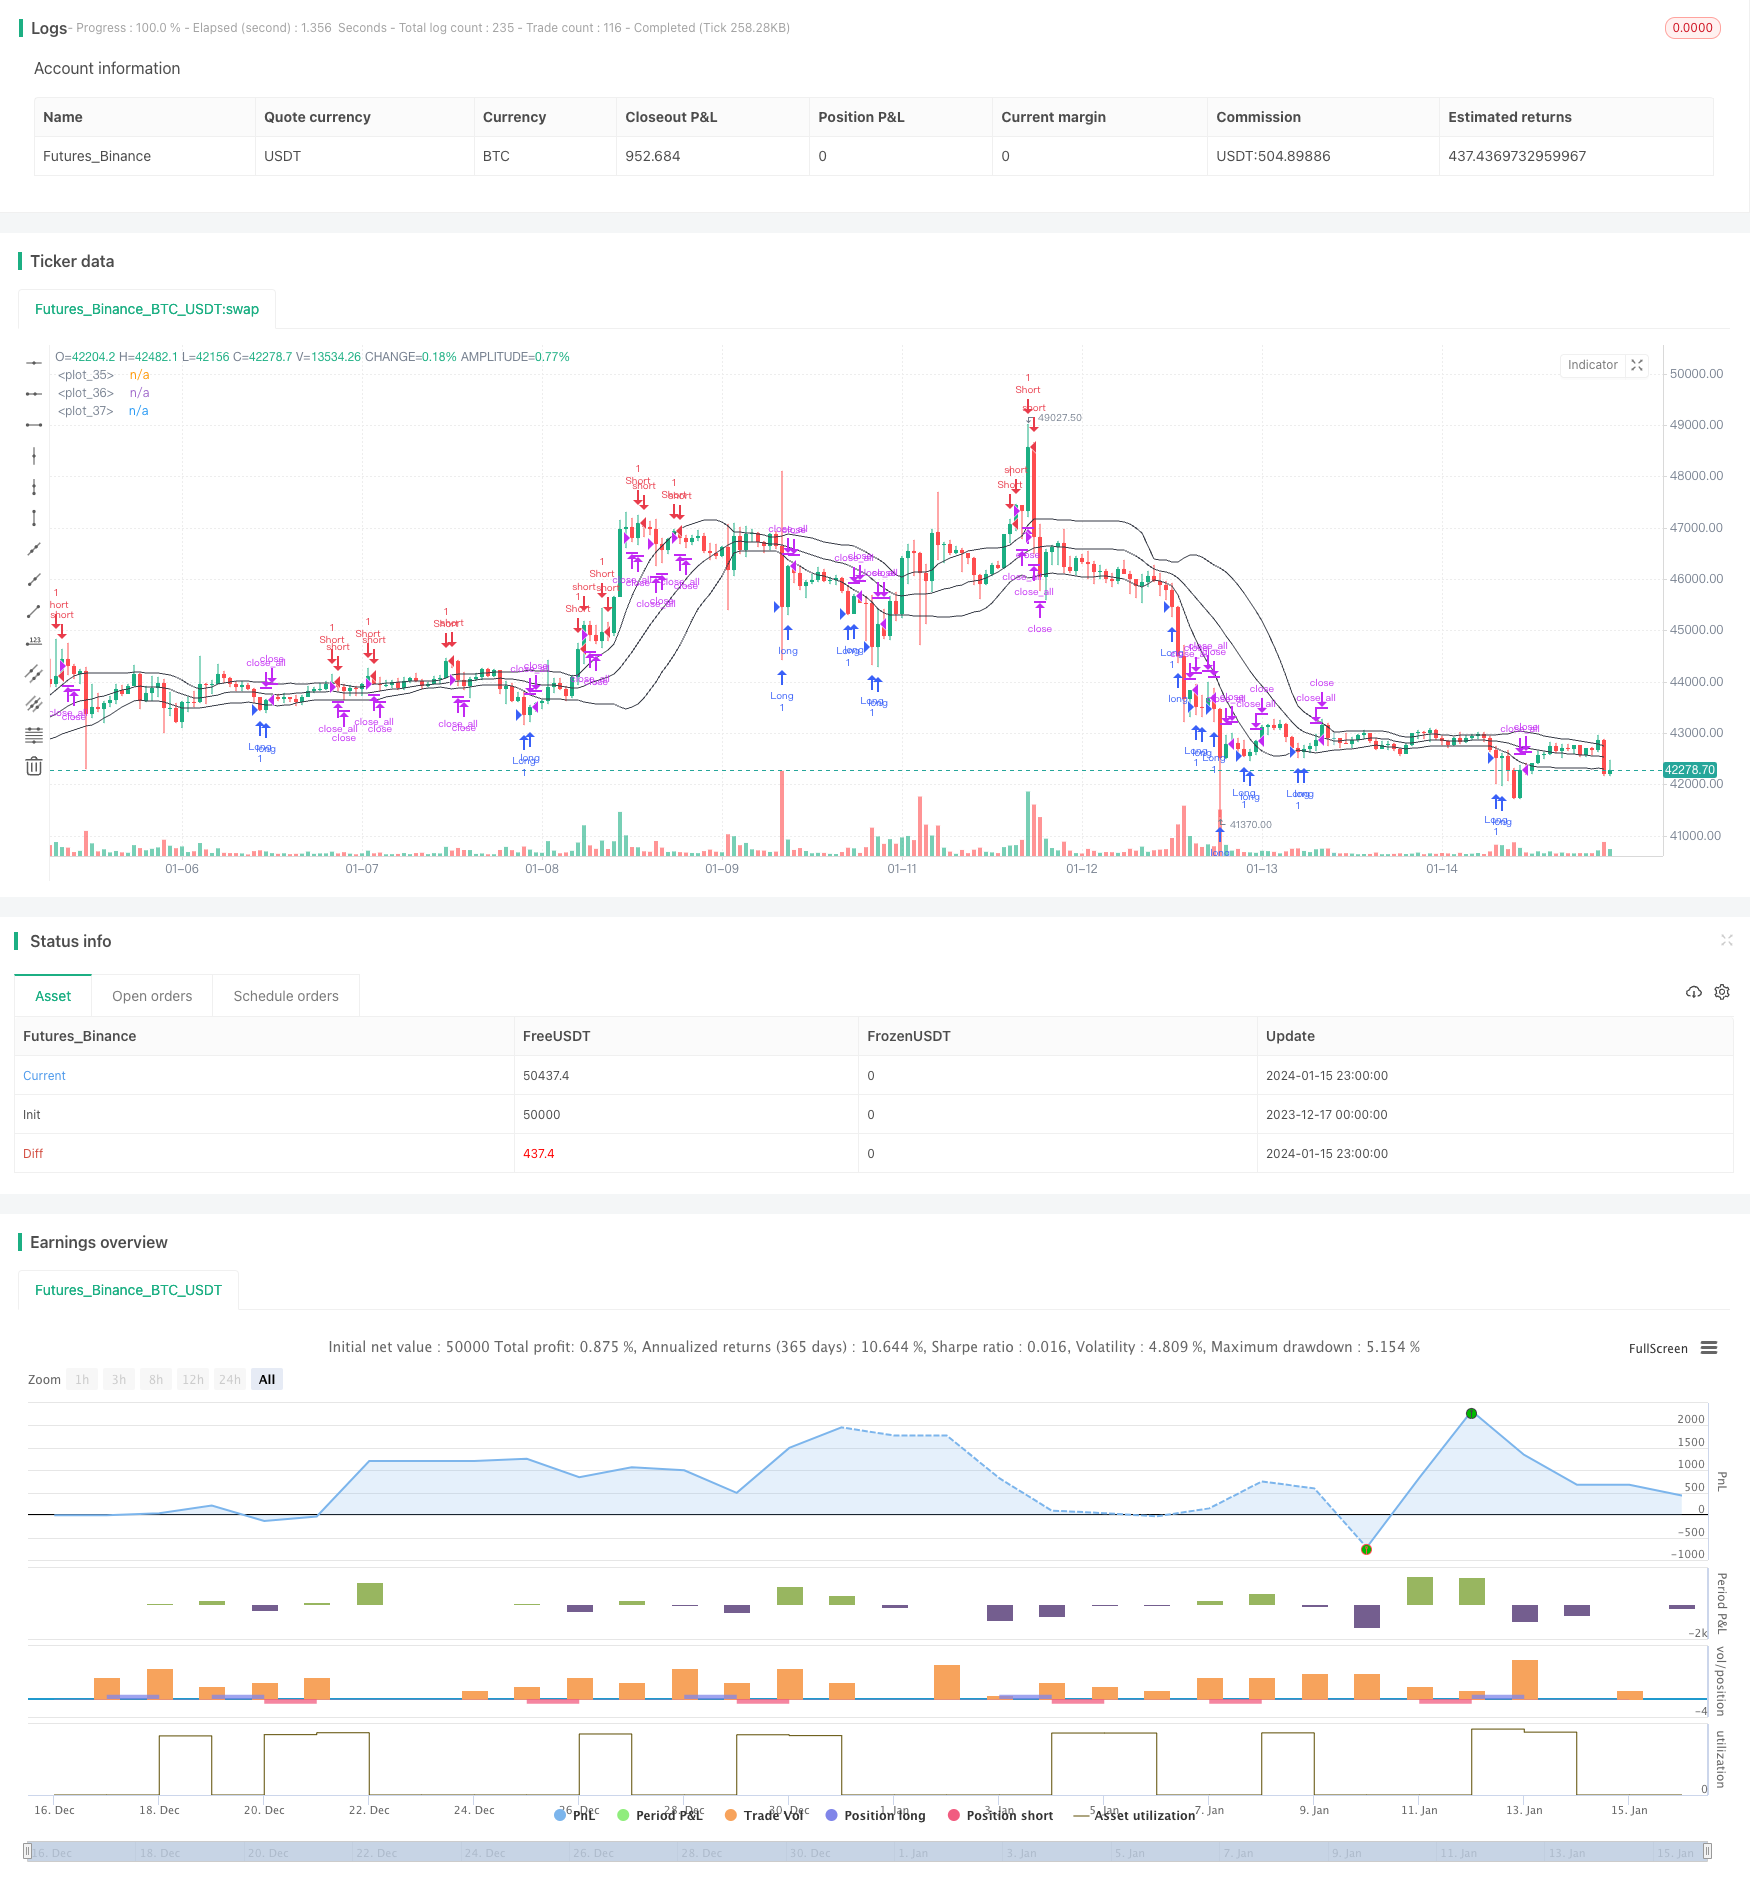
/*backtest
start: 2023-12-17 00:00:00
end: 2024-01-16 00:00:00
period: 1h
basePeriod: 15m
exchanges: [{"eid":"Futures_Binance","currency":"BTC_USDT"}]
*/

//Noro
//2018

//@version=3
strategy("Noro's Bollinger Strategy v1.4", shorttitle = "Bollinger str 1.4", overlay = true )

//Settings
needlong = input(true, defval = true, title = "Long")
needshort = input(false, defval = false, title = "Short")

length = input(20, defval = 20, minval = 1, maxval = 1000, title = "Bollinger Length")
mult = input(1, defval = 1, minval = 0.001, maxval = 50, title = "Bollinger Mult")
source = input(ohlc4, defval = ohlc4, title = "Bollinger Source")

usebf = input(true, defval = true, title = "Use body-filter")
usecf = input(true, defval = true, title = "Use color-filter")
userf = input(true, defval = true, title = "Use RSI-filter")

fromyear = input(1900, defval = 1900, minval = 1900, maxval = 2100, title = "From Year")
toyear = input(2100, defval = 2100, minval = 1900, maxval = 2100, title = "To Year")
frommonth = input(01, defval = 01, minval = 01, maxval = 12, title = "From Month")
tomonth = input(12, defval = 12, minval = 01, maxval = 12, title = "To Month")
fromday = input(01, defval = 01, minval = 01, maxval = 31, title = "From day")
today = input(31, defval = 31, minval = 01, maxval = 31, title = "To day")
showbands = input(true, defval = true, title = "Show Bollinger Bands")

//Bollinger Bands
basis = sma(source, length)
dev = mult * stdev(source, length)
upper = basis + dev
lower = basis - dev

//Lines
col = showbands ? black : na
plot(upper, linewidth = 1, color = col)
plot(basis, linewidth = 1, color = col)
plot(lower, linewidth = 1, color = col)

//Body filter
nbody = abs(close - open)
abody = sma(nbody, 10)
body = nbody > abody / 2 or usebf == false

//Color filter
bar = close > open ? 1 : close < open ? -1 : 0
gb = bar == 1 or usecf == false
rb = bar == -1 or usecf == false

//RSI Filter
fastup = rma(max(change(close), 0), 7)
fastdown = rma(-min(change(close), 0), 7)
rsi = fastdown == 0 ? 100 : fastup == 0 ? 0 : 100 - (100 / (1 + fastup / fastdown))
ursi = rsi > 70 or userf == false
drsi = rsi < 30 or userf == false

//Signals
up = close <= lower and rb and body and drsi and (close < strategy.position_avg_price or strategy.position_size == 0)
dn = close >= upper and gb and body and ursi and (close > strategy.position_avg_price or strategy.position_size == 0)
exit = ((strategy.position_size > 0 and close > open) or (strategy.position_size < 0 and close < open)) and body

//Trading
if up
    strategy.entry("Long", strategy.long, needlong == false ? 0 : na)

if dn
    strategy.entry("Short", strategy.short, needshort == false ? 0 : na)

if  exit
    strategy.close_all()