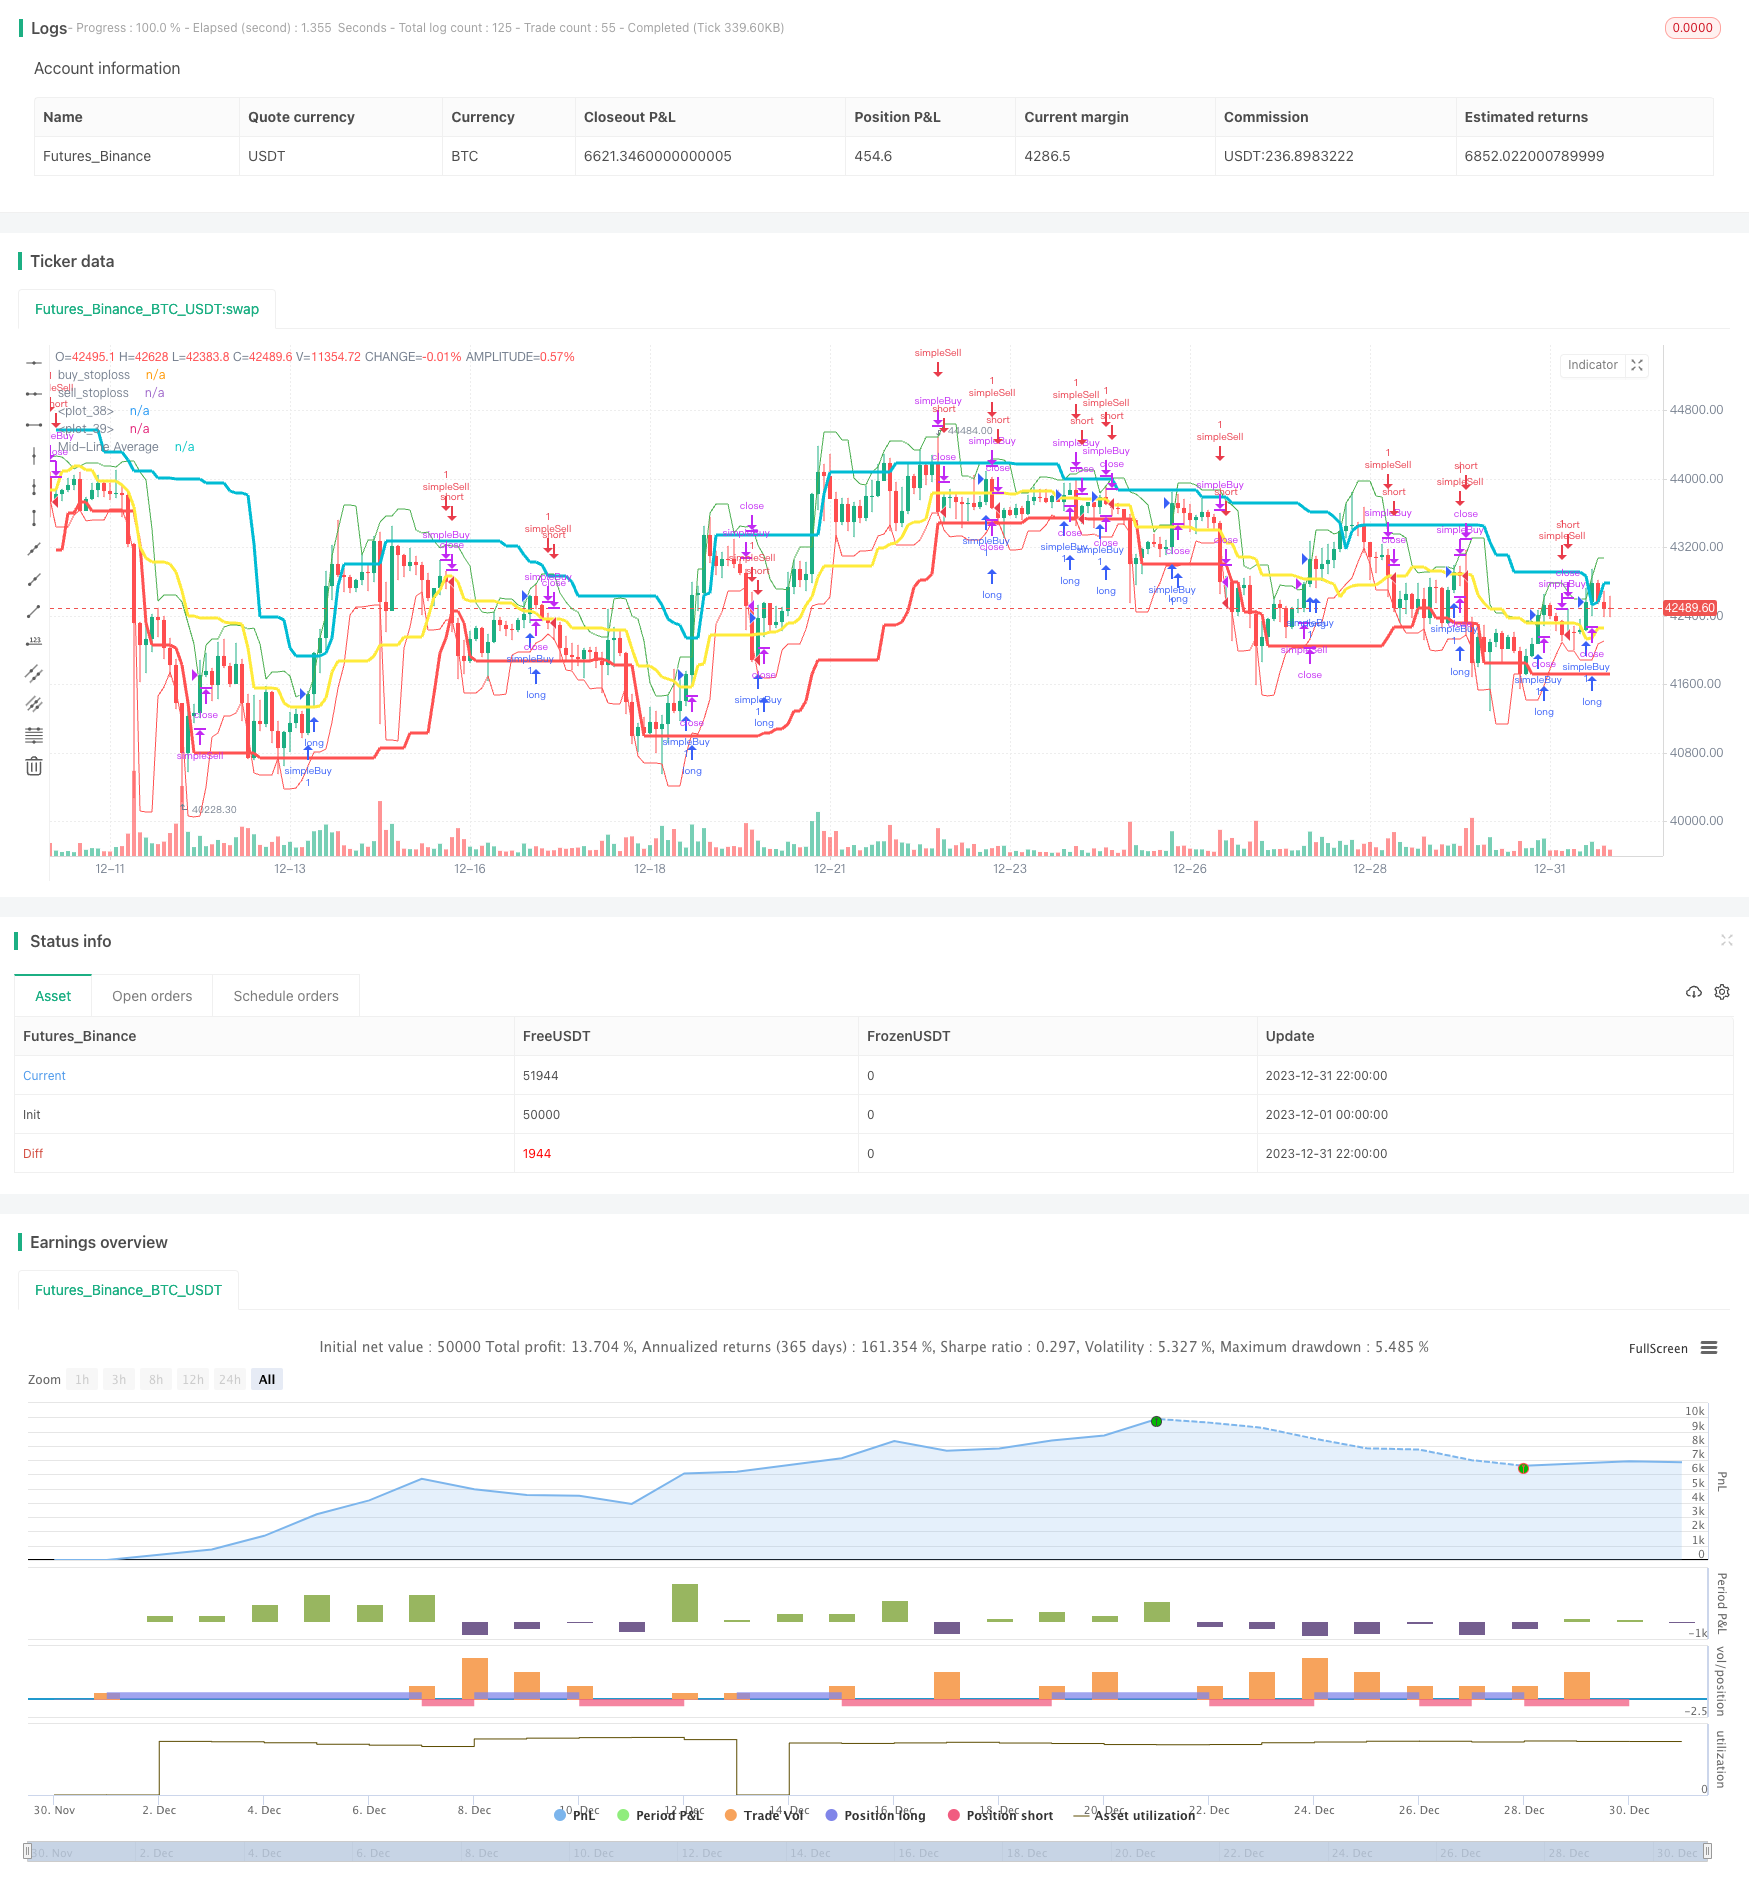
概述
动态通道突破策略是一种趋势跟踪策略。该策略使用Donchian通道指标来动态确定突破买入和卖出价格,结合波动率ATR指标设定止损点,实现交易信号生成和止损退出的全自动化。
策略原理
Donchian通道
Donchian通道是一个动态通道指标,通过计算过去一定周期内的最高价和最低价,形成上轨和下轨。上轨线为过去n周期内的最高价,下轨线为过去n周期内的最低价。 Donchian通道反映了市场的波动范围和潜在趋势。
该策略设置Donchian通道周期为20天。当价格突破上轨时产生买入信号,表明行情进入上涨趋势;当价格跌破下轨时产生卖出信号,表明行情进入下跌趋势。
ATR指标
ATR指标是平均真实波幅(Average True Range)的缩写,它反映了某一资产最近一段时间内的平均波动幅度。ATR可以自动适应市场波动频率的变化,从而更准确地反映市场最近期的实际波幅。
该策略采用20日ATR指标计算止损点。ATR数值越大表示市场波动越大,设置的止损点就越远。这可以防止止损点过于接近,被市场小幅波动击出。
策略信号
当价格上穿Donchian通道中线时,产生买入信号;当价格下穿Donchian通道中线时,产生卖出信号。这表明价格开始突破该通道,进入新一轮的趋势。
同时,结合ATR指标计算的止损点,当亏损达到止损点时主动止损退出仓位,控制风险。
优势分析
自动跟踪趋势
Donchian通道是一种趋势跟踪指标。该策略通过动态调整通道范围,能够自动跟踪市场趋势的变化,进而产生买入和卖出信号。这避免了人工判断的主观性,使交易信号的产生更加客观和可靠。
双边交易
策略同时包含做多和做空规则,可以实现双边交易。这 expands 了策略适用的市场环境,在行情上涨和下跌时均可以获利。
风险控制
结合ATR指标的止损机制可以有效控制单笔交易的损失。这对于量化交易尤为重要,可以保证策略在大概率事件下获得稳定的正收益。
风险分析
被套风险
Donchian通道策略存在一定的被套风险。当价格出现反转,重新进入通道时,如果不止损就会形成重大损失。本策略通过ATR指标的止损机制降低了该风险。
趋势反转风险
在趋势反转的时候,Donchian通道指标会产生错误信号。用户需要关注行情局势,避免在显著趋势反转来临时仍然盲目跟单。本策略中可以加入趋势判断指标等来减少该风险。
参数优化风险
Donchian通道和ATR止损的周期参数需要优化检验,否则将产生过多错误信号。本策略中使用的是经验参数,实盘中需要根据历史数据进行参数优化。
优化方向
结合趋势判断
可以加入移动平均线等趋势判断指标,避免在显著趋势反转点产生错误信号。
参数优化
对Donchian通道和ATR参数进行优化,找到最佳参数组合。适当缩短通道周期可以更快捕捉趋势转折。
结合价格形态
结合其他辅助判断指标,如K线形态、交易量变化等,可以提高信号的准确性,减少不必要的反转交易。
总结
动态通道突破策略通过Donchian通道的上下轨来定位趋势方向,并产生交易信号。结合ATR指标的止损机制控制风险。该策略自动化程度高,适合量化交易。优化空间在于参数选择优化,以及结合其他辅助指标提升信号准确性。总体而言,该策略对市场趋势的判断准确,具有较强的实用性。
/*backtest
start: 2023-12-01 00:00:00
end: 2023-12-31 23:59:59
period: 2h
basePeriod: 15m
exchanges: [{"eid":"Futures_Binance","currency":"BTC_USDT"}]
*/

//@version=4
strategy(title = "dc",  overlay = true)
atrLength = input(title="ATR Length:", defval=20, minval=1)

testStartYear = input(2018, "Backtest Start Year")
testStartMonth = input(1, "Backtest Start Month")
testStartDay = input(1, "Backtest Start Day")
testPeriodStart = timestamp(testStartYear,testStartMonth,testStartDay,0,0)

testEndYear = input(2018, "Backtest Start Year")
testEndMonth = input(12)
testEndDay = input(31, "Backtest Start Day")
testPeriodEnd = timestamp(testStartYear,testStartMonth,testStartDay,0,0)


testPeriod() =>
    true
    //time >= testPeriodStart  ? true : false

dcPeriod = input(20, "Period")

dcUpper = highest(close, dcPeriod)[1]
dcLower = lowest(close, dcPeriod)[1]
dcAverage = (dcUpper + dcLower) / 2
atrValue=atr(atrLength)


useTakeProfit   = na
useStopLoss     = na
useTrailStop    = na
useTrailOffset  = na

Buy_stop = lowest(low[1],3) - atr(20)[1] / 3
plot(Buy_stop, color=red, title="buy_stoploss")
Sell_stop = highest(high[1],3) + atr(20)[1] / 3
plot(Sell_stop, color=green, title="sell_stoploss")

plot(dcLower, style=line, linewidth=3, color=red, offset=1)
plot(dcUpper, style=line, linewidth=3, color=aqua, offset=1)

plot(dcAverage, color=yellow, style=line, linewidth=3, title="Mid-Line Average")

strategy.entry("simpleBuy", strategy.long, when=(close > dcAverage) and cross(close,dcAverage))
strategy.close("simpleBuy",when=((close < dcAverage) and  cross(close,dcAverage)) or ( close< Buy_stop))

strategy.entry("simpleSell", strategy.short,when=(close < dcAverage) and cross(close,dcAverage) )
strategy.close("simpleSell",when=((close > dcAverage) and cross(close,dcAverage)) or ( close > Sell_stop))

//strategy.exit("Exit simpleBuy", from_entry = "simpleBuy", profit = useTakeProfit, loss = useStopLoss, trail_points = useTrailStop, trail_offset = useTrailOffset)
//strategy.exit("Exit simpleSell", from_entry = "simpleSell", profit = useTakeProfit, loss = useStopLoss, trail_points = useTrailStop, trail_offset = useTrailOffset)