概述
本策略的核心是利用ADX指标来判断市场趋势,并结合DI+-指标的差值来自动识别突破点,从而实现自适应交易。当DI+与ADX差值超过设定阈值时做多,当DI-与ADX差值超过设定阈值时做空。该策略可以自动识别趋势突破点,无需人工干预,适合中长线持有。
策略原理
计算True Range,Directional Movement指标,得到DI+、DI-、DX及ADX等指标。
比较DI+与ADX的差值amplitude1, DI-与ADX的差值amplitude2。
当amplitude1大于设定阈值(如10)时产生做多信号;当amplitude2大于设定阈值(如10)时产生做空信号。
并要求ADX介于DI+和DI-之间,以过滤错误信号。
这样,当市场进入趋势状态时,DI+或DI-会明显领先ADX,从而产生交易信号;当市场趋势结束时,DI+、DI- 和ADX会重新贴近,避免追高杀跌。
策略优势
自动识别趋势突破点,无需人工判断。
可灵活调整DI与ADX差值的阈值,适应不同市场环境。
结合ADX指标,可有效过滤错误信号。
持股时间较长,无需高频交易,资金使用率高。
回撤可控,稳定增长。
策略风险
ADX指标滞后,可能错过短线交易机会。可以结合其他指标或减小ADX参数以提高敏感度。
震荡行情中容易被套。可以引入止损策略或增加ADX过滤条件以减少套盘概率。
大幅趋势反转时易损失惨重。可设置移动止损或跟踪止损来控制风险。
策略优化
可以测试不同市场及品种,调整最佳参数组合。
可考虑结合其他指标判断,提高信号准确率。例如MACD,KD等。
增加止损策略以控制回撤和最大损失。
引入仓位管理,根据市场情况调整交易仓位。
优化入场点选择和出场条件,以降低交易风险。
总结
本策略整合ADX和DI指标的优点,实现了对趋势的有效判断和自适应交易。无需频繁操盘,适合中长线持有。同时也存在一定风险,需要加入辅助技术指标和资金管理手段进行改进,可大大提升策略稳定性。该策略思路可靠、逻辑清晰,值得深入研究与应用。
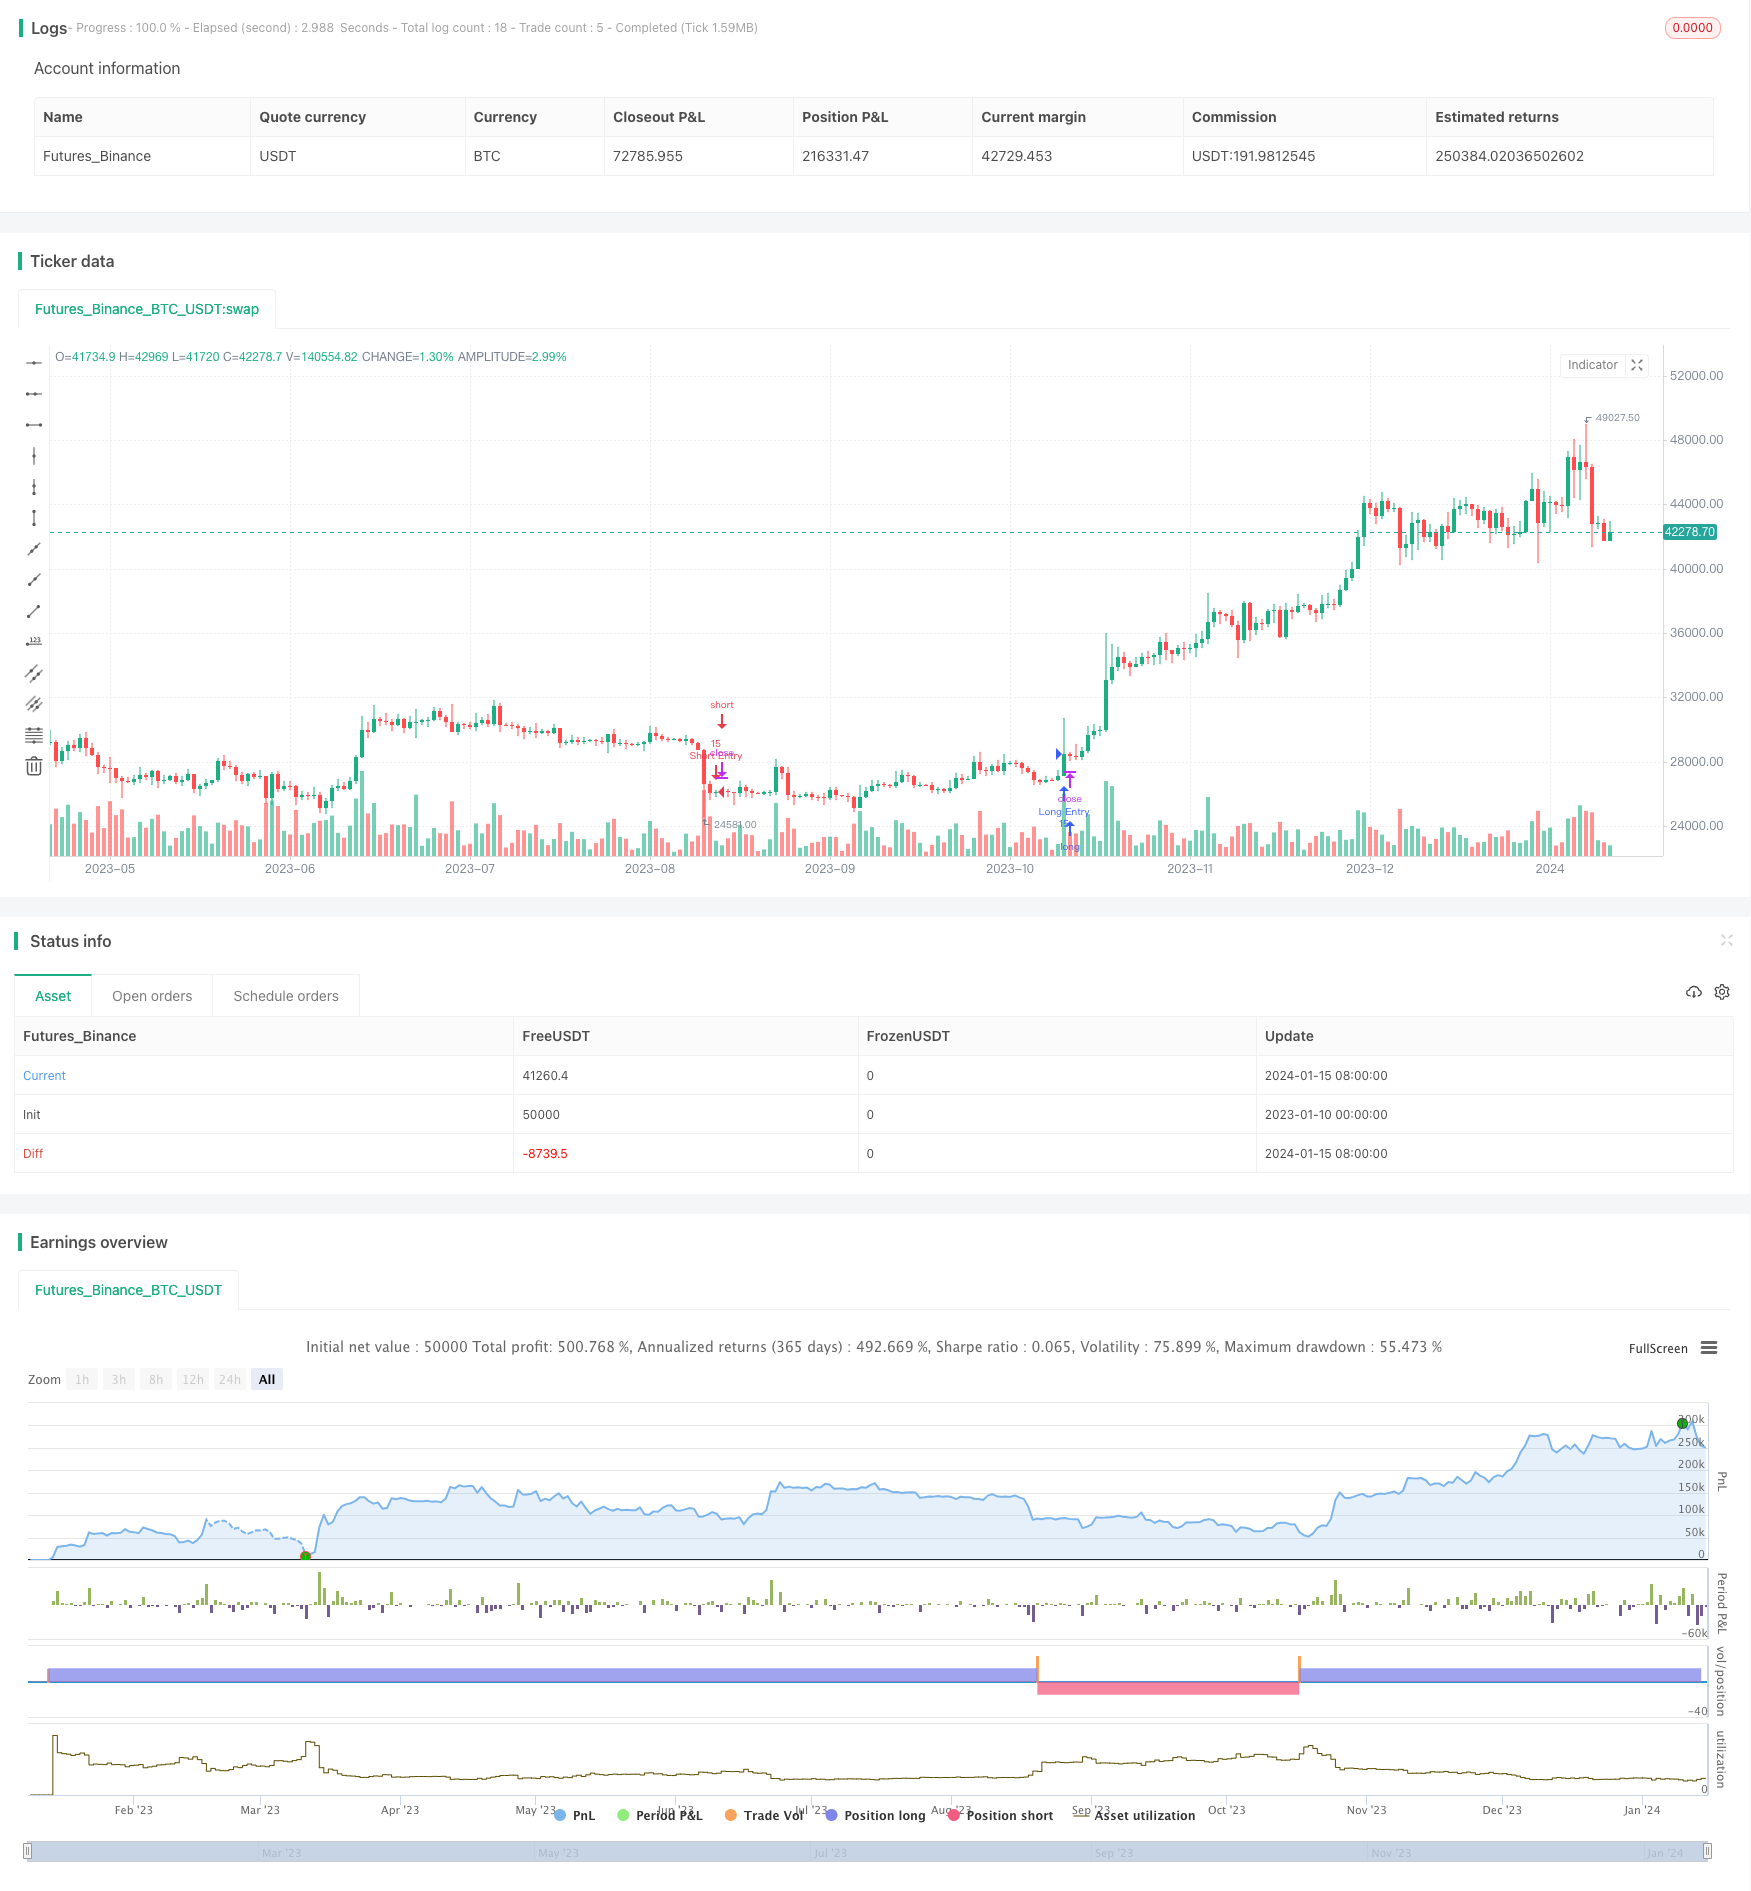
/*backtest
start: 2023-01-10 00:00:00
end: 2024-01-16 00:00:00
period: 1d
basePeriod: 1h
exchanges: [{"eid":"Futures_Binance","currency":"BTC_USDT"}]
*/

// This source code is subject to the terms of the Mozilla Public License 2.0 at https://mozilla.org/MPL/2.0/
// © MAURYA_ALGO_TRADER

//@version=5
strategy("Monthly Performance by Dr. Maurya", overlay=true, default_qty_value = 15, commission_type = strategy.commission.percent, commission_value = 0.1)


len = input(14)
th = input(20)

TrueRange = math.max(math.max(high - low, math.abs(high - nz(close[1]))), math.abs(low - nz(close[1])))
DirectionalMovementPlus = high - nz(high[1]) > nz(low[1]) - low ? math.max(high - nz(high[1]), 0) : 0
DirectionalMovementMinus = nz(low[1]) - low > high - nz(high[1]) ? math.max(nz(low[1]) - low, 0) : 0

SmoothedTrueRange = 0.0
SmoothedTrueRange := nz(SmoothedTrueRange[1]) - nz(SmoothedTrueRange[1]) / len + TrueRange

SmoothedDirectionalMovementPlus = 0.0
SmoothedDirectionalMovementPlus := nz(SmoothedDirectionalMovementPlus[1]) - nz(SmoothedDirectionalMovementPlus[1]) / len + DirectionalMovementPlus

SmoothedDirectionalMovementMinus = 0.0
SmoothedDirectionalMovementMinus := nz(SmoothedDirectionalMovementMinus[1]) - nz(SmoothedDirectionalMovementMinus[1]) / len + DirectionalMovementMinus

DIPlus = SmoothedDirectionalMovementPlus / SmoothedTrueRange * 100
DIMinus = SmoothedDirectionalMovementMinus / SmoothedTrueRange * 100
DX = math.abs(DIPlus - DIMinus) / (DIPlus + DIMinus) * 100
ADX = ta.sma(DX, len)


//diff_1 = math.abs(DIPlus - DIMinus)
diff_2 = math.abs(DIPlus-ADX)
diff_3 = math.abs(DIMinus - ADX)

long_diff = input(10, "Long Difference")
short_diff = input(10, "Short Difference")

buy_condition = diff_2 >=long_diff and diff_3 >=long_diff and (ADX < DIPlus and ADX > DIMinus)
sell_condition = diff_2 >=short_diff and diff_3 >=short_diff and (ADX > DIPlus and ADX < DIMinus)


if buy_condition
    strategy.entry("Long Entry", strategy.long, comment = "Long")
if sell_condition
    strategy.entry("Short Entry", strategy.short, comment = "Short")


// Copy below code to end of the desired strategy script
///////////////////////////////////////////////////////////////////////////////////////////////////////////////////////
//                                 monthly pnl performance  by Dr. Maurya @MAURYA_ALGO_TRADER                        //
///////////////////////////////////////////////////////////////////////////////////////////////////////////////////////
show_performance = input.bool(true, 'Show Monthly Monthly Performance ?', group='Monthly Performance')

dash_loc_mp = input("Bottom Right","Location"  ,options=["Top Right","Bottom Right","Top Left","Bottom Left", "Middle Right","Bottom Center"]  ,group='Monthly Performance', inline = "performance")

text_size_mp = input('Small',"Size"  ,options=["Tiny","Small","Normal","Large"]  ,group='Monthly Performance', inline = "performance")

bg_c = input.color( color.rgb(7, 226, 242, 38), "Background Color", group='Monthly Performance')

text_head_color = input.color( color.rgb(0,0,0), "Month/Year Heading Color", group='Monthly Performance')

tab_month_c = input.color( color.white, "Month PnL Data Color", group='Monthly Performance')

tab_year_c = input.color( color.rgb(0,0,0), "Year PnL Data Color", group='Monthly Performance')

border_c = input.color( color.white, "Table Border Color", group='Monthly Performance')


var table_position_mp = dash_loc_mp == 'Top Left' ? position.top_left :
  dash_loc_mp == 'Bottom Left' ? position.bottom_left :
  dash_loc_mp == 'Middle Right' ? position.middle_right :
  dash_loc_mp == 'Bottom Center' ? position.bottom_center :
  dash_loc_mp == 'Top Right' ? position.top_right : position.bottom_right

var table_text_size_mp = text_size_mp == 'Tiny' ? size.tiny :
  text_size_mp == 'Small' ? size.small :
  text_size_mp == 'Normal' ? size.normal : size.large

/////////////////
strategy.initial_capital =50000

/////////////////////////////////////////////

// var bool new_month = na
new_month = ta.change(month) //> 0 ? true : false
newest_month = new_month and strategy.closedtrades >= 1

// profit
only_profit = strategy.netprofit
initial_balance = strategy.initial_capital

// month number
var int month_number = na
month_number := (ta.valuewhen(newest_month, month(time), 0)) //and month(time) > 1 ? (ta.valuewhen(newest_month, month(time), 0) - 1) :  12 //1 to 12

//month_year
var int month_time = na
month_time := ta.valuewhen(newest_month, time, 0) - 2419200000


var int m_counter = 0
if newest_month
    m_counter += 1


// current month values
var bool new_year = na
new_year := ta.change(year)
curr_m_pnl = only_profit - nz(ta.valuewhen(newest_month, only_profit, 0), 0)
curr_m_number = newest_month ? ta.valuewhen(newest_month, month(time), 0) : month(time)
curr_y_pnl = (only_profit - nz(ta.valuewhen(new_year, only_profit, 0),0))


var float [] net_profit_array = array.new_float()
var int [] month_array = array.new_int()
var int [] month_time_array = array.new_int()


if newest_month
    array.push(net_profit_array, only_profit)
    array.push(month_array, month_number)
    array.push(month_time_array, month_time)


var float [] y_pnl_array = array.new_float()
var int [] y_number_array = array.new_int()
var int [] y_time_array = array.new_int()

newest_year = ta.change(year) and strategy.closedtrades >= 1
get_yearly_pnl = nz(ta.valuewhen(newest_year, strategy.netprofit, 0) - nz(ta.valuewhen(newest_year, strategy.netprofit, 1), 0), 0)
get_m_year = ta.valuewhen(newest_year, year(time), 1)
get_y_time = ta.valuewhen(newest_year, time, 0)

if newest_year
    array.push(y_pnl_array, get_yearly_pnl)
    array.push(y_number_array, get_m_year)
    array.push(y_time_array, get_y_time)
var float monthly_profit = na
var int column_month_number = na
var int row_month_time = na


var testTable = table.new(position = table_position_mp, columns = 14, rows = 40, bgcolor = bg_c, border_color = border_c, border_width = 1)
if barstate.islastconfirmedhistory and show_performance
    table.cell(table_id = testTable, column = 0, row = 0, text = "YEAR", text_color = text_head_color, text_size=table_text_size_mp)
    table.cell(table_id = testTable, column = 1, row = 0, text = "JAN", text_color = text_head_color, text_size=table_text_size_mp)
    table.cell(table_id = testTable, column = 2, row = 0, text = "FEB", text_color = text_head_color, text_size=table_text_size_mp)
    table.cell(table_id = testTable, column = 3, row = 0, text = "MAR", text_color = text_head_color, text_size=table_text_size_mp)
    table.cell(table_id = testTable, column = 4, row = 0, text = "APR", text_color = text_head_color, text_size=table_text_size_mp)
    table.cell(table_id = testTable, column = 5, row = 0, text = "MAY", text_color = text_head_color, text_size=table_text_size_mp)
    table.cell(table_id = testTable, column = 6, row = 0, text = "JUN", text_color = text_head_color, text_size=table_text_size_mp)
    table.cell(table_id = testTable, column = 7, row = 0, text = "JUL", text_color = text_head_color, text_size=table_text_size_mp)
    table.cell(table_id = testTable, column = 8, row = 0, text = "AUG", text_color = text_head_color, text_size=table_text_size_mp)
    table.cell(table_id = testTable, column = 9, row = 0, text = "SEP", text_color = text_head_color, text_size=table_text_size_mp)
    table.cell(table_id = testTable, column = 10, row = 0, text = "OCT", text_color = text_head_color, text_size=table_text_size_mp)
    table.cell(table_id = testTable, column = 11, row = 0, text = "NOV", text_color = text_head_color, text_size=table_text_size_mp)
    table.cell(table_id = testTable, column = 12, row = 0, text = "DEC", text_color =text_head_color, text_size=table_text_size_mp)
    table.cell(table_id = testTable, column = 13, row = 0, text = "YEAR P/L", text_color = text_head_color, text_size=table_text_size_mp)

    for i = 0 to (array.size(y_number_array) == 0 ? na : array.size(y_number_array) - 1)
        row_y = year(array.get(y_time_array, i)) - year(array.get(y_time_array, 0)) + 1
        table.cell(table_id = testTable, column = 13, row = row_y, text = str.tostring(array.get(y_pnl_array , i), "##.##") + '\n' + '(' + str.tostring(array.get(y_pnl_array , i)*100/initial_balance, "##.##") + ' %)', bgcolor = array.get(y_pnl_array , i) > 0 ? color.green : array.get(y_pnl_array , i) < 0 ? color.red : color.gray, text_color = tab_year_c, text_size=table_text_size_mp)
    curr_row_y = array.size(month_time_array) == 0 ? 1 : (year(array.get(month_time_array, array.size(month_time_array) - 1))) - (year(array.get(month_time_array, 0))) + 1
    table.cell(table_id = testTable, column = 13, row = curr_row_y, text = str.tostring(curr_y_pnl, "##.##") + '\n' + '(' + str.tostring(curr_y_pnl*100/initial_balance, "##.##") + ' %)', bgcolor = curr_y_pnl > 0 ? color.green : curr_y_pnl < 0 ? color.red : color.gray, text_color = tab_year_c, text_size=table_text_size_mp)


    for i = 0 to (array.size(net_profit_array) == 0 ? na : array.size(net_profit_array) - 1)
        monthly_profit := i > 0 ? ( array.get(net_profit_array, i) - array.get(net_profit_array, i - 1) ) : array.get(net_profit_array, i)
        column_month_number := month(array.get(month_time_array, i))
        row_month_time :=((year(array.get(month_time_array, i))) - year(array.get(month_time_array, 0)) ) + 1
        table.cell(table_id = testTable, column = column_month_number, row = row_month_time, text = str.tostring(monthly_profit, "##.##") + '\n' + '(' + str.tostring(monthly_profit*100/initial_balance, "##.##") + ' %)', bgcolor = monthly_profit > 0 ? color.green : monthly_profit < 0 ? color.red : color.gray, text_color = tab_month_c, text_size=table_text_size_mp)
        table.cell(table_id = testTable, column = 0, row =row_month_time, text = str.tostring(year(array.get(month_time_array, i)), "##.##"), text_color = text_head_color, text_size=table_text_size_mp)

    curr_row_m = array.size(month_time_array) == 0 ? 1 : (year(array.get(month_time_array, array.size(month_time_array) - 1))) - (year(array.get(month_time_array, 0))) + 1
    table.cell(table_id = testTable, column = curr_m_number, row = curr_row_m, text = str.tostring(curr_m_pnl, "##.##") + '\n' + '(' + str.tostring(curr_m_pnl*100/initial_balance, "##.##") + ' %)', bgcolor = curr_m_pnl > 0 ? color.green : curr_m_pnl < 0 ? color.red : color.gray, text_color = tab_month_c, text_size=table_text_size_mp)
    table.cell(table_id = testTable, column = 0, row =curr_row_m, text = str.tostring(year(time), "##.##"), text_color = text_head_color, text_size=table_text_size_mp)

//============================================================================================================================================================================