概述
本策略利用抛物线转向系统(Parabolic SAR)指标识别股价趋势的转折点,在转折点发生时进行买入或卖出操作。该策略可以自动识别股价的上涨和下跌趋势,并相应调整头寸。
策略原理
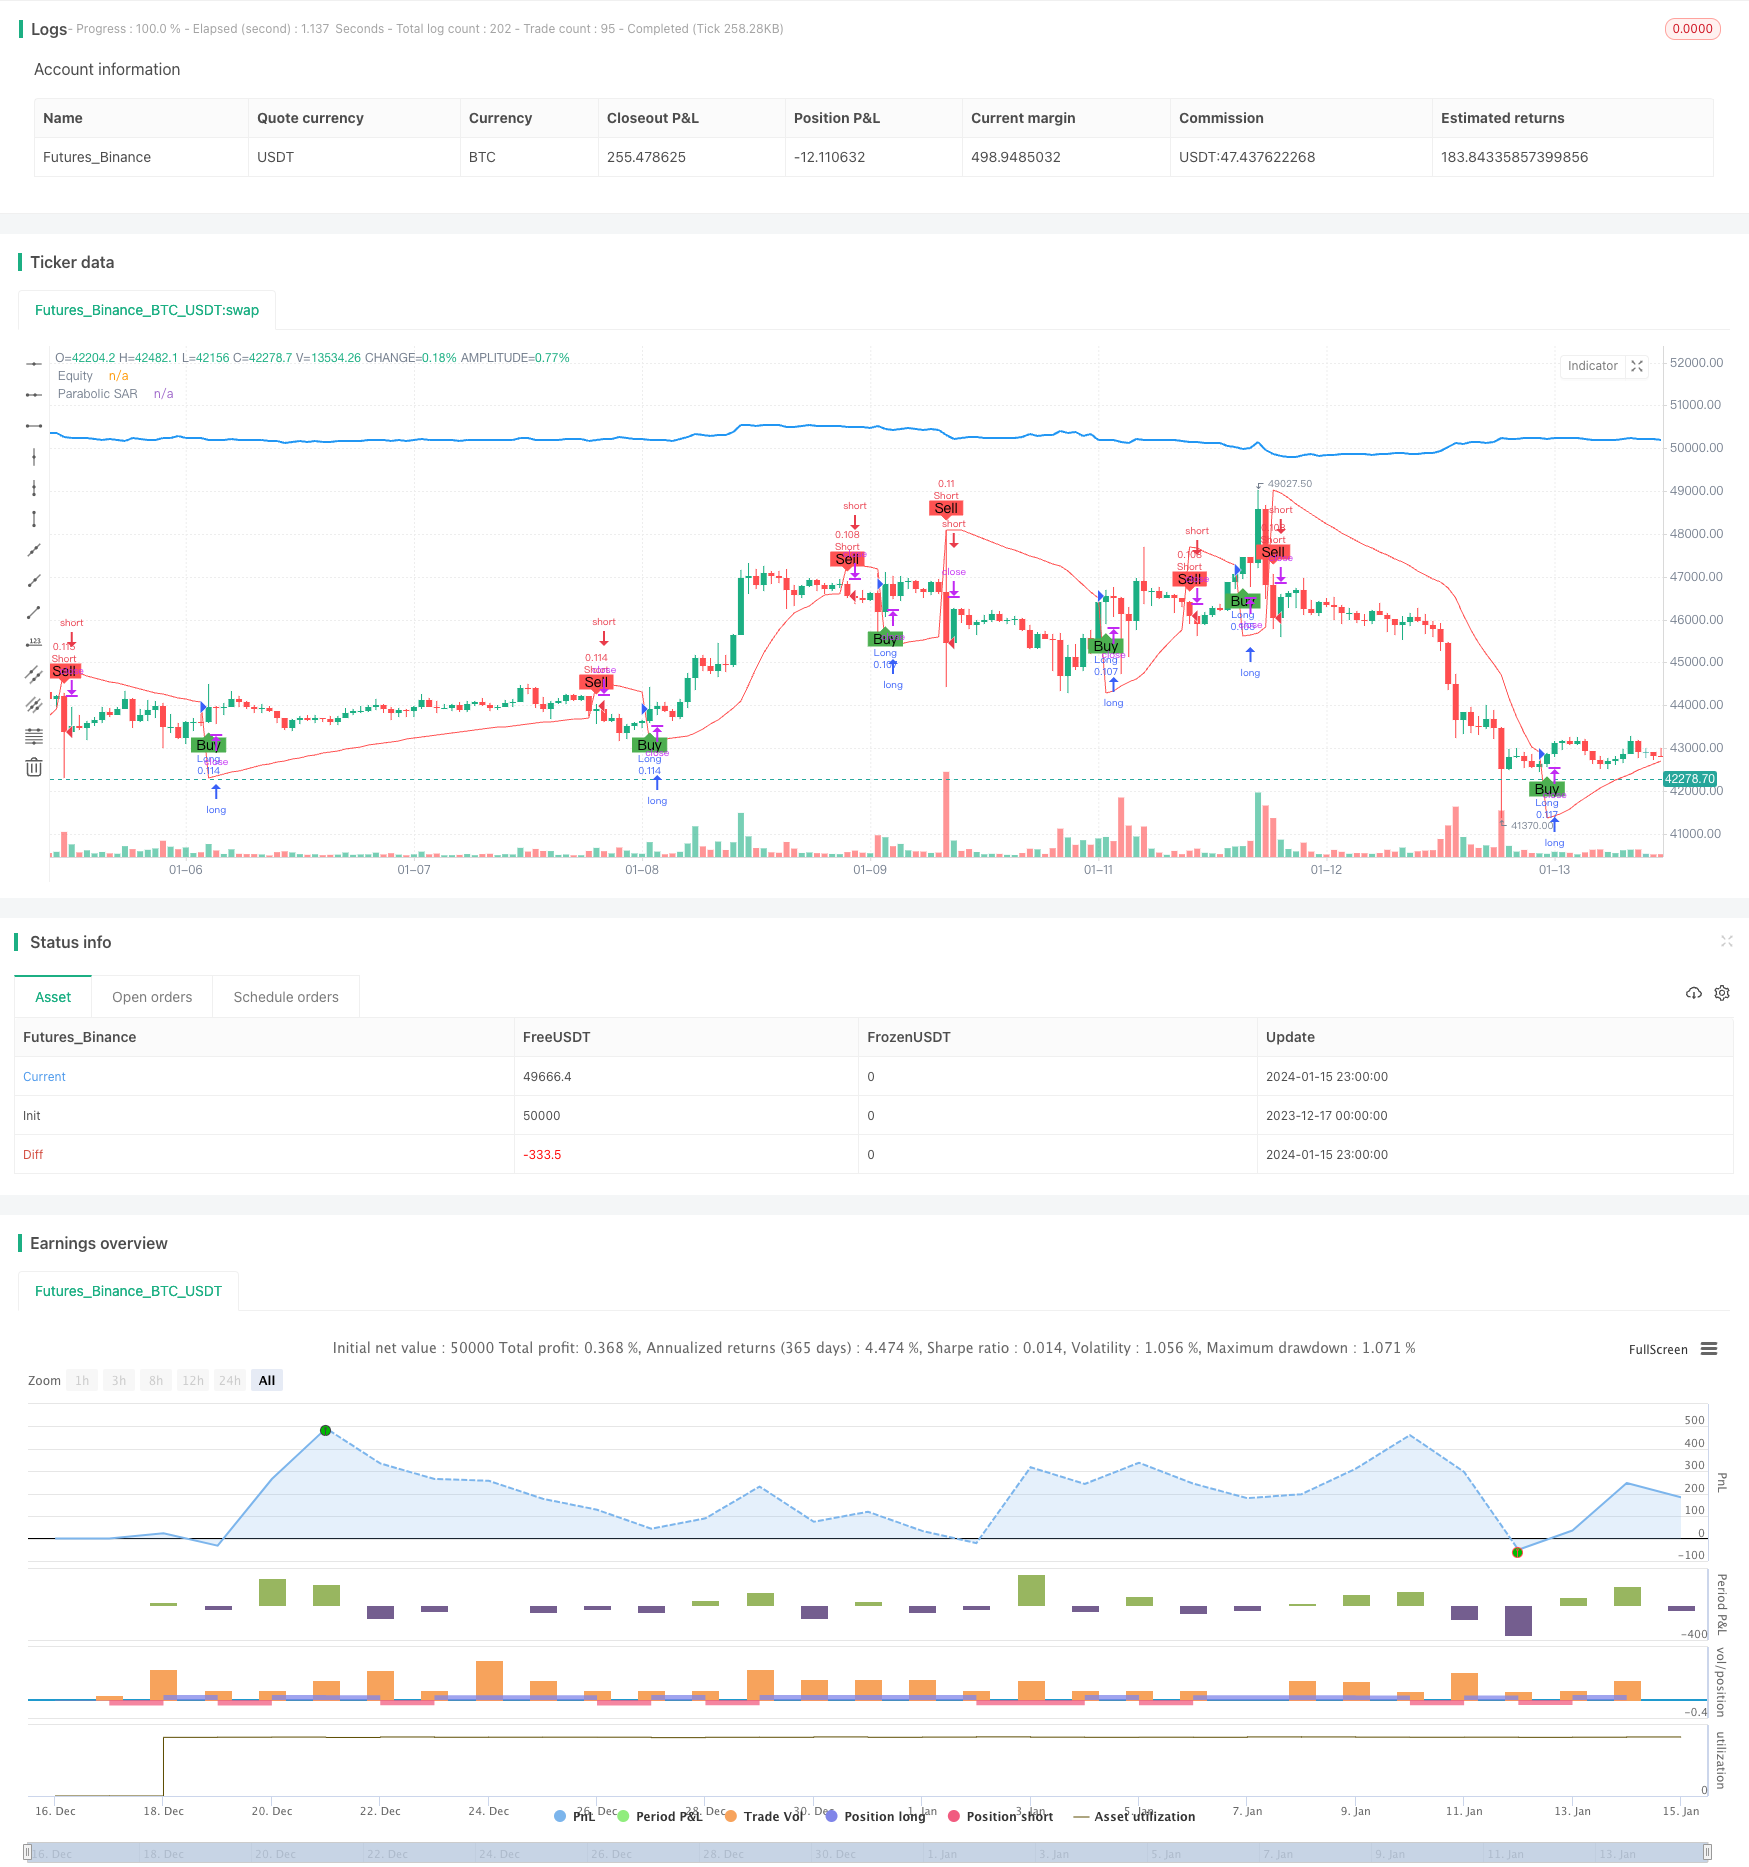
本策略的核心指标是抛物线转向系统(Parabolic SAR)。该指标能够识别股价的上涨趋势和下跌趋势,当股价上涨时SAR点会位于股价的下方,当股价下跌时SAR点会跃升到股价的上方。策略通过检测股价线和SAR点的交叉作为买入和卖出信号。具体来说,当股价线从下方上扫SAR点时产生买入信号;当股价线从上方下破SAR点时产生卖出信号。
该策略的买入条件是:close高于sar,表示股价线从下方上扫穿了SAR点,属于买入信号;卖出条件是close低于sar,表示股价线从上方下破了SAR点,属于卖出信号。所以,本策略的核心逻辑就是追踪股价运动的动能转折点,在转折点发生交叉时进行买入和卖出操作。
策略优势
本策略最大的优势在于能够自动识别股价趋势的转折点,无需人工判断,避免了追高杀跌的常见错误。抛物线转向系统是一种具有良好可靠性的趋势识别指标,可以减少误操作的机会。
另外,SAR指标对股价的反应也比较灵敏,可以及时捕捉到价格的小范围调整,这对于追求高胜率和频繁交易的策略而言是非常必要的。所以该策略可以自动调整持仓,避免被困在大幅度调整的局面中。
策略风险
本策略最大的风险在于SAR指标对股价变化反应太灵敏,小幅震荡可能会产生错误信号,导致过于频繁地进行买入卖出操作,增加交易成本和滑点损失。
另外,在股票大幅上涨或者下跌的时候,SAR指标的设置参数如起始值、递增值等,可能会影响其判断趋势转折的准确性和及时性,需要谨慎设置这些参数。
如果不适当配置仓位管理,过于追踪SAR信号,可能导致仓位过于频繁波动,增加实际交易的难度。
优化建议
该策略可以从以下几个方面进行优化:
优化SAR参数设置,调整参数组合,找到最优参数以提高信号判断的准确性
增加其他辅助指标进行确认,避免SAR指标的误报导致不必要的头寸切换
配置适当的仓位和止损策略,避免过于频繁交易,控制风险
结合趋势判断指标,避免在震荡行情中被套
优化买入卖出的具体价格,考虑成本和滑点损失,提高交易效率
总结
本策略主要依赖抛物线转向系统指标判断股价趋势的转折点,具有可靠的趋势判断能力。策略优化后可以成为一个有效的趋势跟踪策略,通过自动调整持仓获取股价的方向性机会。但需要注意控制仓位波动频率,并防范误报风险。
/*backtest
start: 2023-12-17 00:00:00
end: 2024-01-16 00:00:00
period: 1h
basePeriod: 15m
exchanges: [{"eid":"Futures_Binance","currency":"BTC_USDT"}]
*/

//@version=5
strategy("Parabolic SAR Strategy", shorttitle="PSAR", overlay=true, default_qty_type=strategy.percent_of_equity, default_qty_value=10)

// Parabolic SAR settings
start = input(0.02, title="Start")
increment = input(0.02, title="Increment")
maximum = input(0.2, title="Maximum")

// Calculate Parabolic SAR
sar = ta.sar(start, increment, maximum)

// Plot Parabolic SAR on the chart
plot(sar, color=color.red, title="Parabolic SAR")

// Strategy logic
longCondition = ta.crossover(close, sar)
shortCondition = ta.crossunder(close, sar)

// Execute strategy orders
strategy.entry("Long", strategy.long, when=longCondition)
strategy.entry("Short", strategy.short, when=shortCondition)

// Plot buy and sell signals on the chart
plotshape(series=longCondition, title="Buy Signal", color=color.green, style=shape.labelup, location=location.belowbar, text="Buy")
plotshape(series=shortCondition, title="Sell Signal", color=color.red, style=shape.labeldown, location=location.abovebar, text="Sell")

// Calculate equity manually
equity = strategy.equity
equity_str = str.tostring(equity)
equity_plot = plot(equity, title="Equity", color=color.blue, linewidth=2)

// Update equity plot only on bar close to avoid repainting issues
label.new(bar_index, na, text=equity_str, style=label.style_none, color=color.blue, yloc=yloc.abovebar)