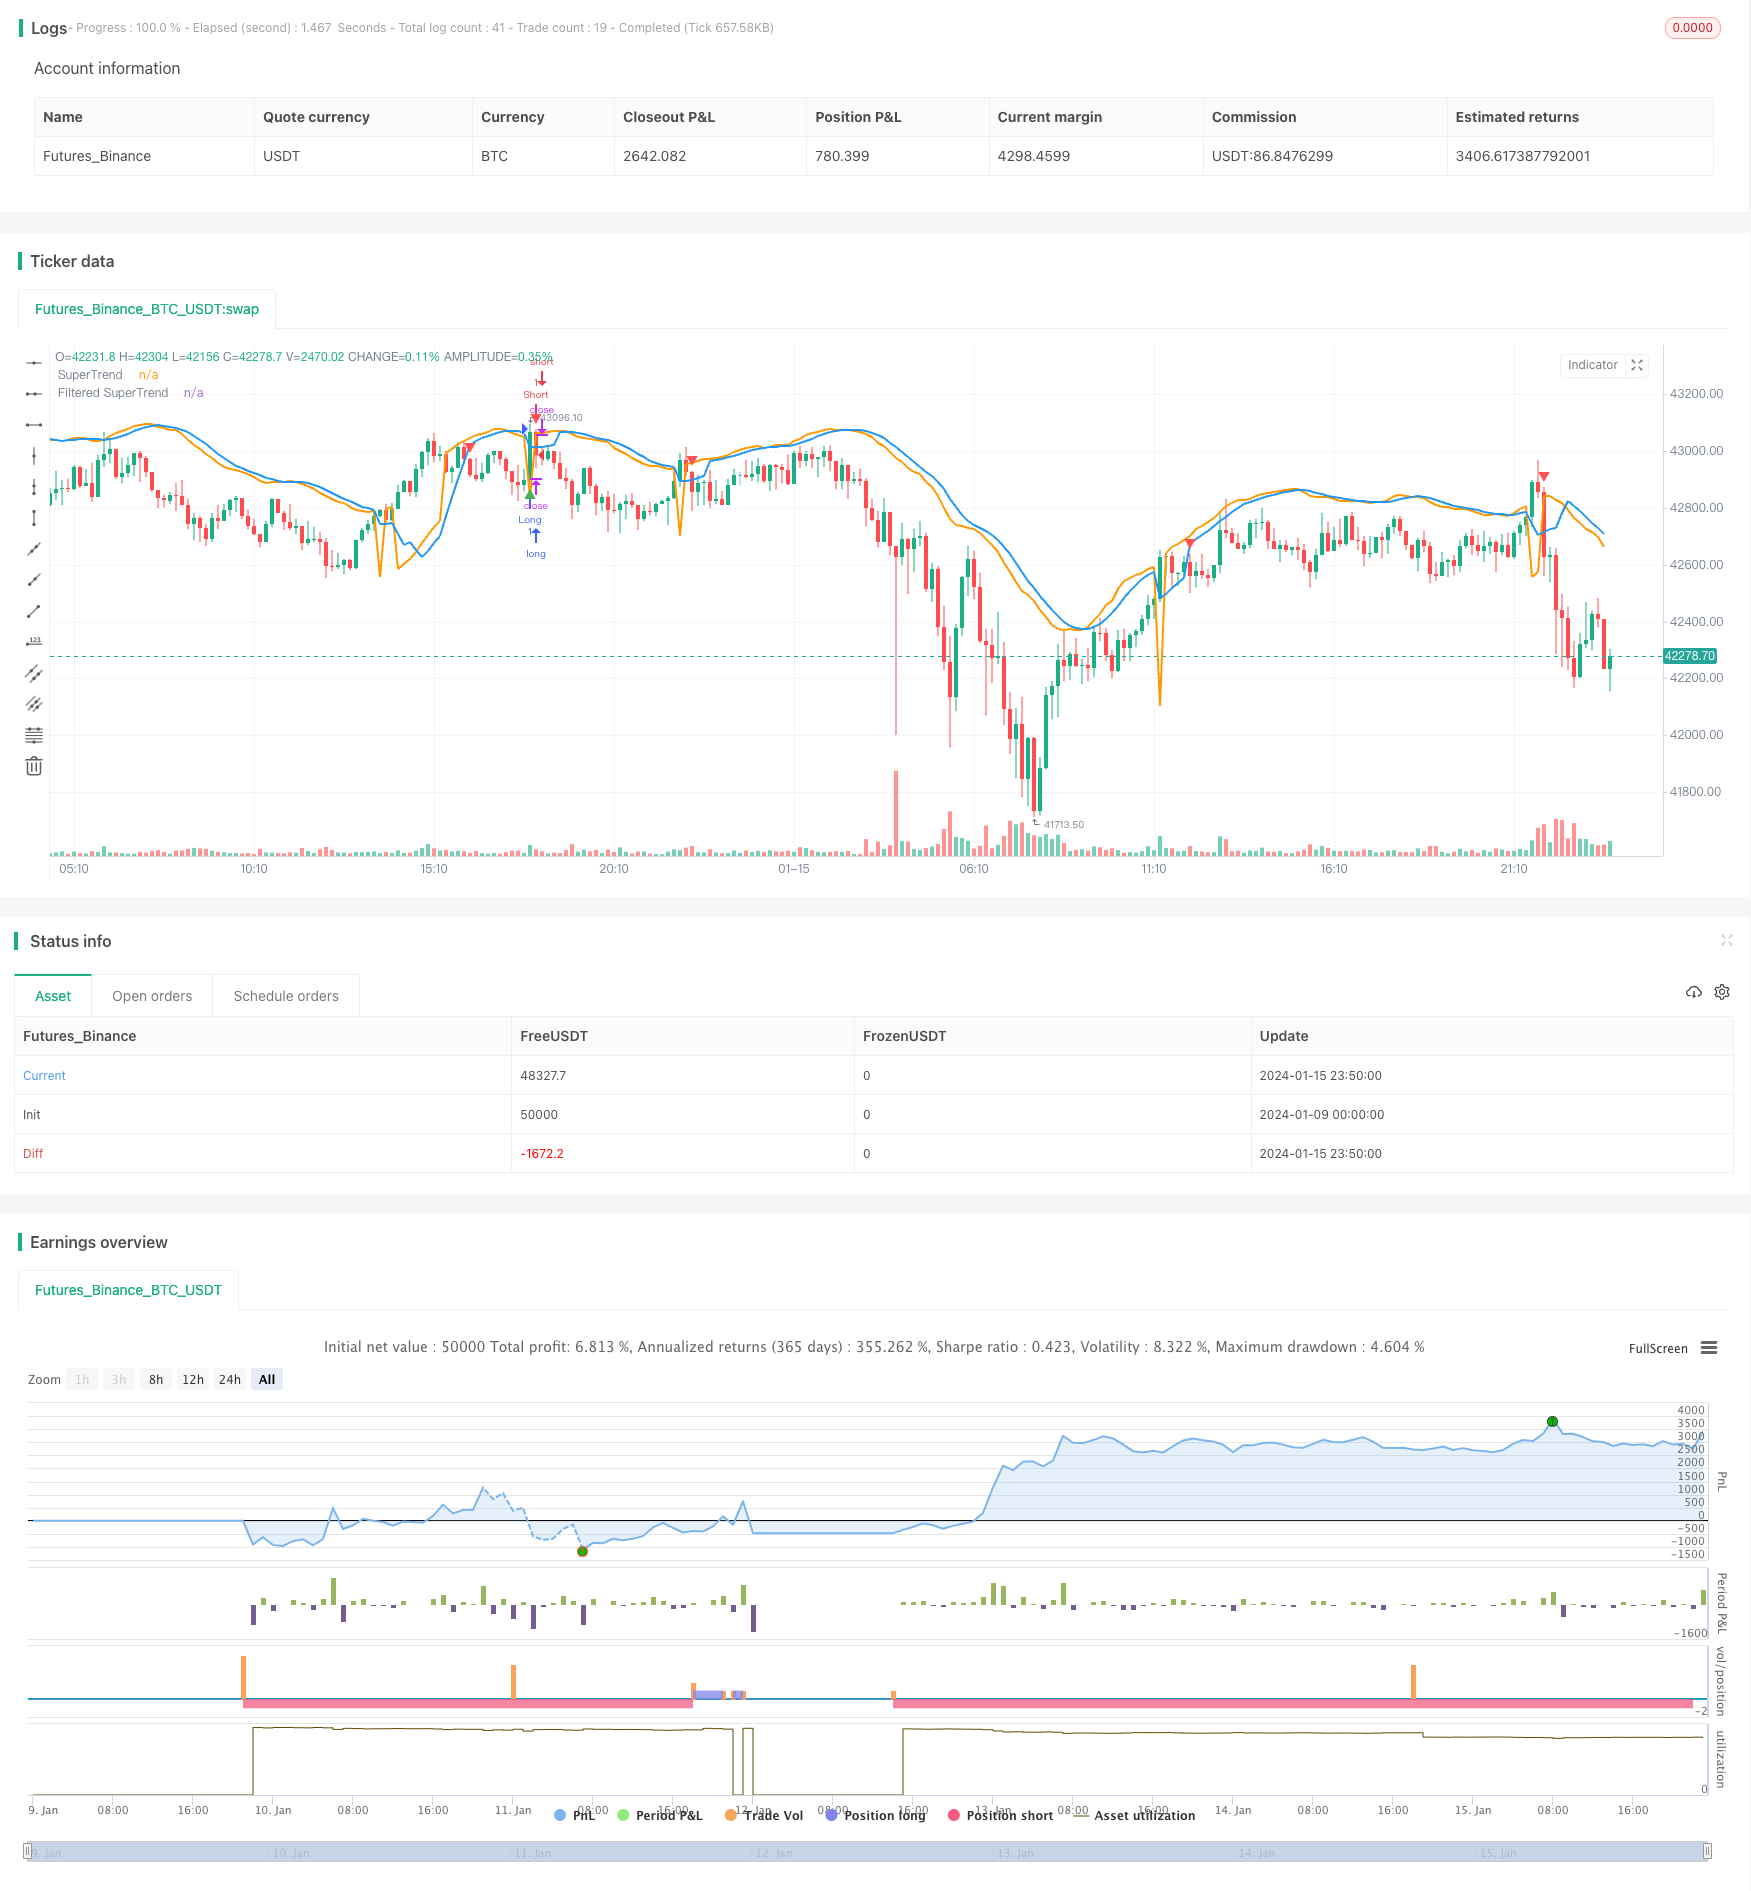
概述
本文详细分析了一个结合SuperTrend指标和Stochastic RSI过滤器的改进趋势跟踪策略。该策略旨在生成买入和卖出信号,同时考虑市场趋势和减少假信号。Stochastic RSI用于避免超买超卖情况下的假信号。
策略原理
SuperTrend计算
首先,计算真实波动范围(TR)和平均真实波动范围(ATR)。然后利用ATR计算上轨和下轨:
上轨 = SMA(收盘价, ATR周期) + ATR乘数 × ATR 下轨 = SMA(收盘价, ATR周期) - ATR乘数 × ATR
如果收盘价高于下轨,则为上升趋势;如果收盘价低于上轨,则为下降趋势。在上升趋势中,SuperTrend为下轨;在下降趋势中,SuperTrend为上轨。
过滤机制
为了减少假信号,对SuperTrend进行移动平均来获得过滤后的SuperTrend。
Stochastic RSI
计算RSI的值,然后应用Stochastic指标生成Stochastic RSI。它反映RSI是否处于超买或超卖区域。
入场退出条件
买入条件:收盘价上穿过滤后的SuperTrend且处于上升趋势,且Stochastic RSI < 80 卖出条件:收盘价下穿过滤后的SuperTrend且处于下降趋势,且Stochastic RSI > 20
退出买入:收盘价下穿过滤后的SuperTrend且处于上升趋势 退出卖出:收盘价上穿过滤后的SuperTrend且处于下降趋势
策略优势
这是一个改进的趋势跟踪策略,相比简单的移动平均等指标有以下优势:
- SuperTrend本身就具有较强的趋势识别能力和滤波假信号的能力。
- 应用过滤机制进一步减少了假信号,使信号更加可靠。
- Stochastic RSI避免了超买超卖情况下产生的假信号,让策略在重要支持阻力区域附近发出信号。
- 策略同时考虑了趋势方向和 Stochastic RSI 的超买超卖情况,较好地平衡了跟踪趋势和避免假信号之间的关系。
- 策略参数可以灵活调整,适用于不同市场环境。
策略风险及优化
可能的风险
- 在剧烈波动的市场中,止损可能被突破。
- SuperTrend和过滤机制都有滞后,可能错过最近的价格变化。
- Stochastic RSI参数设置不当也会影响策略表现。
风险应对
- 适当调整止损,或使用违约止损。
- 调整参数ATR周期、过滤周期以平衡滞后性。
- 测试并优化Stochastic RSI的参数。
优化方向
- 测试不同的参数组合,寻找最佳参数。
- 尝试不同的过滤机制,如EMA平滑等。
- 应用机器学习算法自动优化参数。
- 结合其他指标补充入场根据。
总结
本策略整合了SuperTrend和Stochastic RSI两个指标的优势,能够有效识别趋势,发出高质量的交易信号。同时过滤机制也使其对市场噪音更具鲁棒性。此策略可通过参数优化获得更好的策略效果,也可以考虑与其他指标或模型相结合。总的来说,该策略表现出良好的跟踪趋势能力,并具有一定的风险控制机制,适合那些追求稳定收益的投资者。
/*backtest
start: 2024-01-09 00:00:00
end: 2024-01-16 00:00:00
period: 10m
basePeriod: 1m
exchanges: [{"eid":"Futures_Binance","currency":"BTC_USDT"}]
*/

//@version=5
strategy("Improved SuperTrend Strategy with Stochastic RSI", shorttitle="IST+StochRSI", overlay=true)

// Input parameters
atr_length = input(14, title="ATR Length")
atr_multiplier = input(1.5, title="ATR Multiplier")
filter_length = input(5, title="Filter Length")
stoch_length = input(14, title="Stochastic RSI Length")
smooth_k = input(3, title="Stochastic RSI %K Smoothing")

// Calculate True Range (TR) and Average True Range (ATR)
tr = ta.rma(ta.tr, atr_length)
atr = ta.rma(tr, atr_length)

// Calculate SuperTrend
upper_band = ta.sma(close, atr_length) + atr_multiplier * atr
lower_band = ta.sma(close, atr_length) - atr_multiplier * atr

is_uptrend = close > lower_band
is_downtrend = close < upper_band

super_trend = is_uptrend ? lower_band : na
super_trend := is_downtrend ? upper_band : super_trend

// Filter for reducing false signals
filtered_super_trend = ta.sma(super_trend, filter_length)

// Calculate Stochastic RSI
rsi_value = ta.rsi(close, stoch_length)
stoch_rsi = ta.sma(ta.stoch(rsi_value, rsi_value, rsi_value, stoch_length), smooth_k)

// Entry conditions
long_condition = ta.crossover(close, filtered_super_trend) and is_uptrend and stoch_rsi < 80
short_condition = ta.crossunder(close, filtered_super_trend) and is_downtrend and stoch_rsi > 20

// Exit conditions
exit_long_condition = ta.crossunder(close, filtered_super_trend) and is_uptrend
exit_short_condition = ta.crossover(close, filtered_super_trend) and is_downtrend

// Plot SuperTrend and filtered SuperTrend
plot(super_trend, color=color.orange, title="SuperTrend", linewidth=2)
plot(filtered_super_trend, color=color.blue, title="Filtered SuperTrend", linewidth=2)

// Plot Buy and Sell signals
plotshape(series=long_condition, title="Buy Signal", color=color.green, style=shape.triangleup, location=location.belowbar)
plotshape(series=short_condition, title="Sell Signal", color=color.red, style=shape.triangledown, location=location.abovebar)

// Output signals to the console for analysis
plotchar(long_condition, "Long Signal", "▲", location.belowbar, color=color.green, size=size.small)
plotchar(short_condition, "Short Signal", "▼", location.abovebar, color=color.red, size=size.small)

// Strategy entry and exit
strategy.entry("Long", strategy.long, when=long_condition)
strategy.entry("Short", strategy.short, when=short_condition)
strategy.close("Long", when=exit_long_condition)
strategy.close("Short", when=exit_short_condition)