本策略通过计算价格的ATR波动率,结合不同周期的VWAP均价,设定长仓入场和出场条件,实现股票的趋势跟踪交易。
策略概述
该策略主要应用于股票类产品的趋势追踪,通过计算ATR波动率并结合不同周期的VWAP价格,设定买入卖出条件,实现对趋势的判断和跟踪。策略较为灵活,可在长线和短线之间切换,适用于捕捉中长线趋势。
策略原理
策略利用ATR指标计算价格波动率,并结合价格是否突破波动率通道判断趋势方向。同时引入不同周期的VWAP价格判断长短线趋势一致性。具体逻辑如下:
- 计算价格的ATR波动率通道
- 判断价格是否突破波动率通道
- 突破上轨时判断为看多趋势
- 突破下轨时判断为看空趋势
- 引入周线和日线VWAP价格
- 价格突破波动率上轨时,如果日线和周线VWAP均在价格上方,则产生长仓信号
- 价格突破波动率下轨时,如果日线和周线VWAP均在价格下方,则产生空仓信号
以上为策略的核心逻辑。ATR波动率判断短期趋势,VWAP价格判断长期趋势,二者结合判断趋势一致性,从而产生交易信号。
策略优势
- 利用ATR和VWAP的组合判断趋势,更加可靠
- 可配置ATR周期参数,调整策略的灵敏度
- 引入不同周期VWAP,判断长短线趋势一致性
- 可灵活在长线和短线之间切换
- 适用于追踪股票中长线趋势
策略风险与优化
- 作为趋势跟踪策略,在震荡调整阶段会产生更多交易,带来滑点风险
- ATR和VWAP参数设置会影响策略表现,需要针对不同品种谨慎测试
- 可考虑加入止损机制,控制单笔损失
- 可结合均线等指标过滤入场信号,减少不必要交易
总结
本策略通过ATR波动率和VWAP双重判断,实现对股票趋势的跟踪。策略优化空间较大,可调整参数或加入其他技术指标优化信号。总体来说,策略逻辑清晰易懂,表现稳健,适合追踪中长线趋势。
策略源码
/*backtest
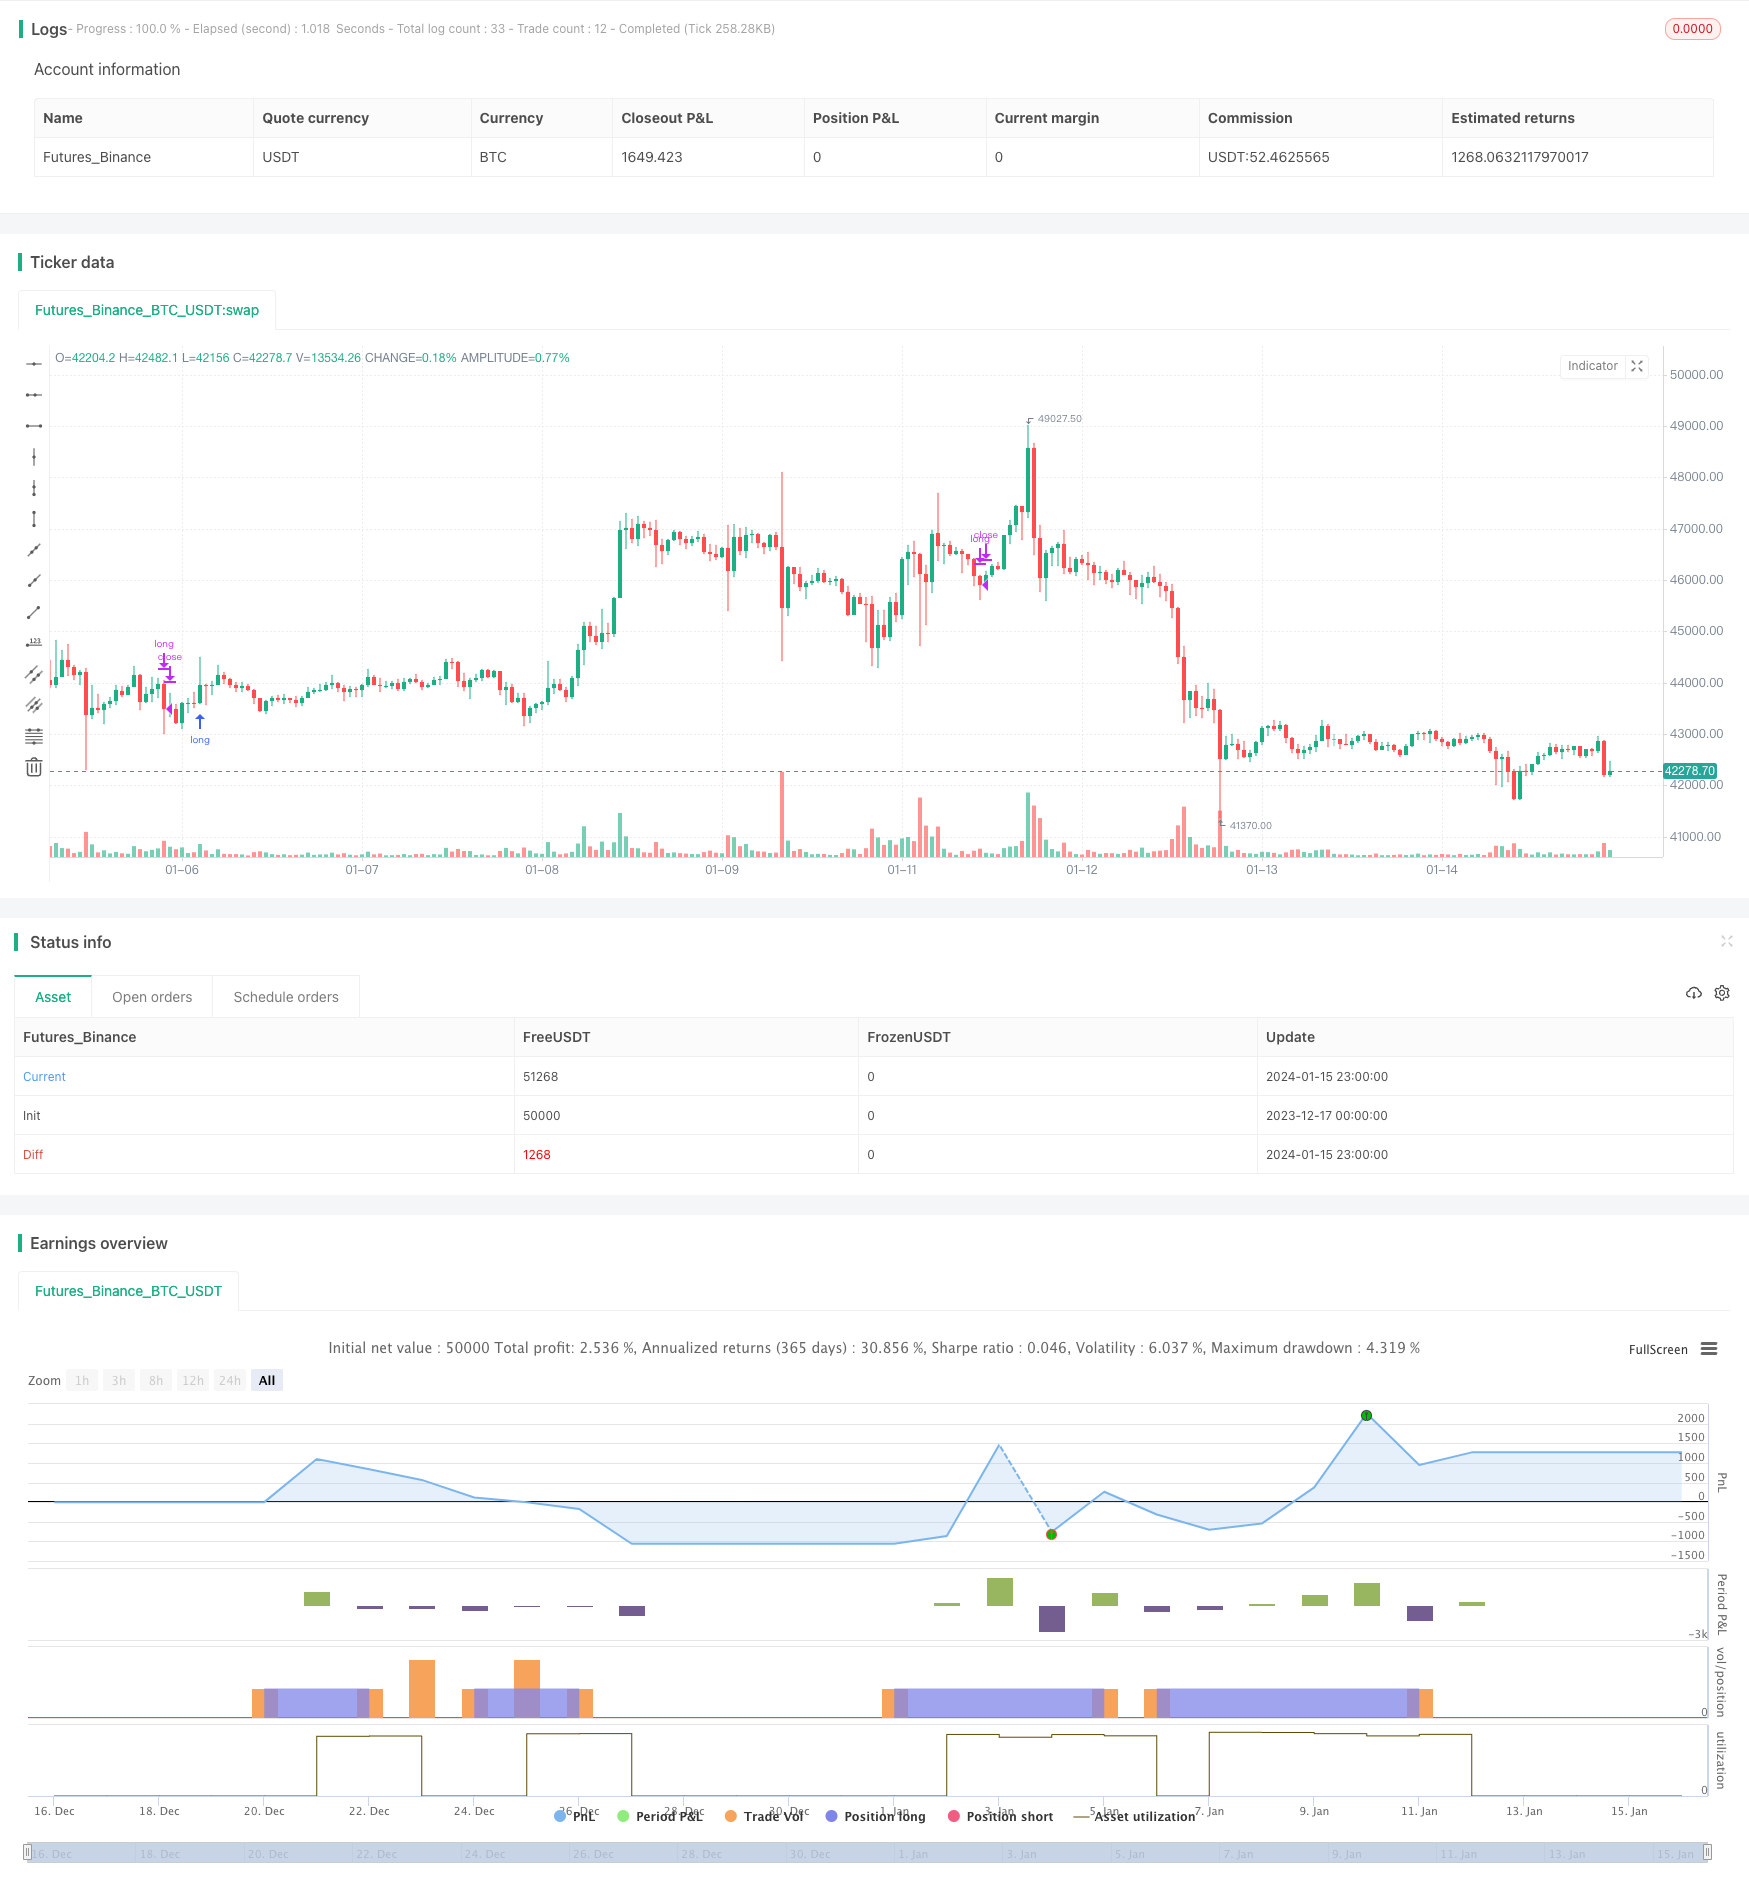
start: 2023-12-17 00:00:00
end: 2024-01-16 00:00:00
period: 1h
basePeriod: 15m
exchanges: [{"eid":"Futures_Binance","currency":"BTC_USDT"}]
*/
// This source code is subject to the terms of the Mozilla Public License 2.0 at https://mozilla.org/MPL/2.0/
// © exlux99
//@version=4
strategy(title="VWAP MTF STOCK STRATEGY", overlay=true )
// high^2 / 2 - low^2 -2
h=pow(high,2) / 2
l=pow(low,2) / 2
o=pow(open,2) /2
c=pow(close,2) /2
x=(h+l+o+c) / 4
y= sqrt(x)
source = y
useTrueRange = false
length = input(27, minval=1)
mult = input(0, step=0.1)
ma = sma(source, length)
range = useTrueRange ? tr : high - low
rangema = sma(range, length)
upper = ma + rangema * mult
lower = ma - rangema * mult
crossUpper = crossover(source, upper)
crossLower = crossunder(source, lower)
bprice = 0.0
bprice := crossUpper ? high+syminfo.mintick : nz(bprice[1])
sprice = 0.0
sprice := crossLower ? low -syminfo.mintick : nz(sprice[1])
crossBcond = false
crossBcond := crossUpper ? true
: na(crossBcond[1]) ? false : crossBcond[1]
crossScond = false
crossScond := crossLower ? true
: na(crossScond[1]) ? false : crossScond[1]
cancelBcond = crossBcond and (source < ma or high >= bprice )
cancelScond = crossScond and (source > ma or low <= sprice )
longOnly = true
fromDay = input(defval = 1, title = "From Day", minval = 1, maxval = 31)
fromMonth = input(defval = 1, title = "From Month", minval = 1, maxval = 12)
fromYear = input(defval = 2000, title = "From Year", minval = 1970)
//monday and session
// To Date Inputs
toDay = input(defval = 31, title = "To Day", minval = 1, maxval = 31)
toMonth = input(defval = 12, title = "To Month", minval = 1, maxval = 12)
toYear = input(defval = 2021, title = "To Year", minval = 1970)
startDate = timestamp(fromYear, fromMonth, fromDay, 00, 00)
finishDate = timestamp(toYear, toMonth, toDay, 00, 00)
time_cond = true
srcX = input(ohlc4)
t = time("W")
start = na(t[1]) or t > t[1]
sumSrc = srcX * volume
sumVol = volume
sumSrc := start ? sumSrc : sumSrc + sumSrc[1]
sumVol := start ? sumVol : sumVol + sumVol[1]
vwapW= sumSrc / sumVol
//crossUpper = crossover(source, upper)
//crossLower = crossunder(source, lower)
shortCondition = close < vwap and time_cond and (close < vwapW)
longCondition = close > vwap and time_cond and (close > vwapW)
if(longOnly and time_cond)
if (crossLower and close < vwapW )
strategy.close("long")
if (crossUpper and close>vwapW)
strategy.entry("long", strategy.long, stop=bprice)