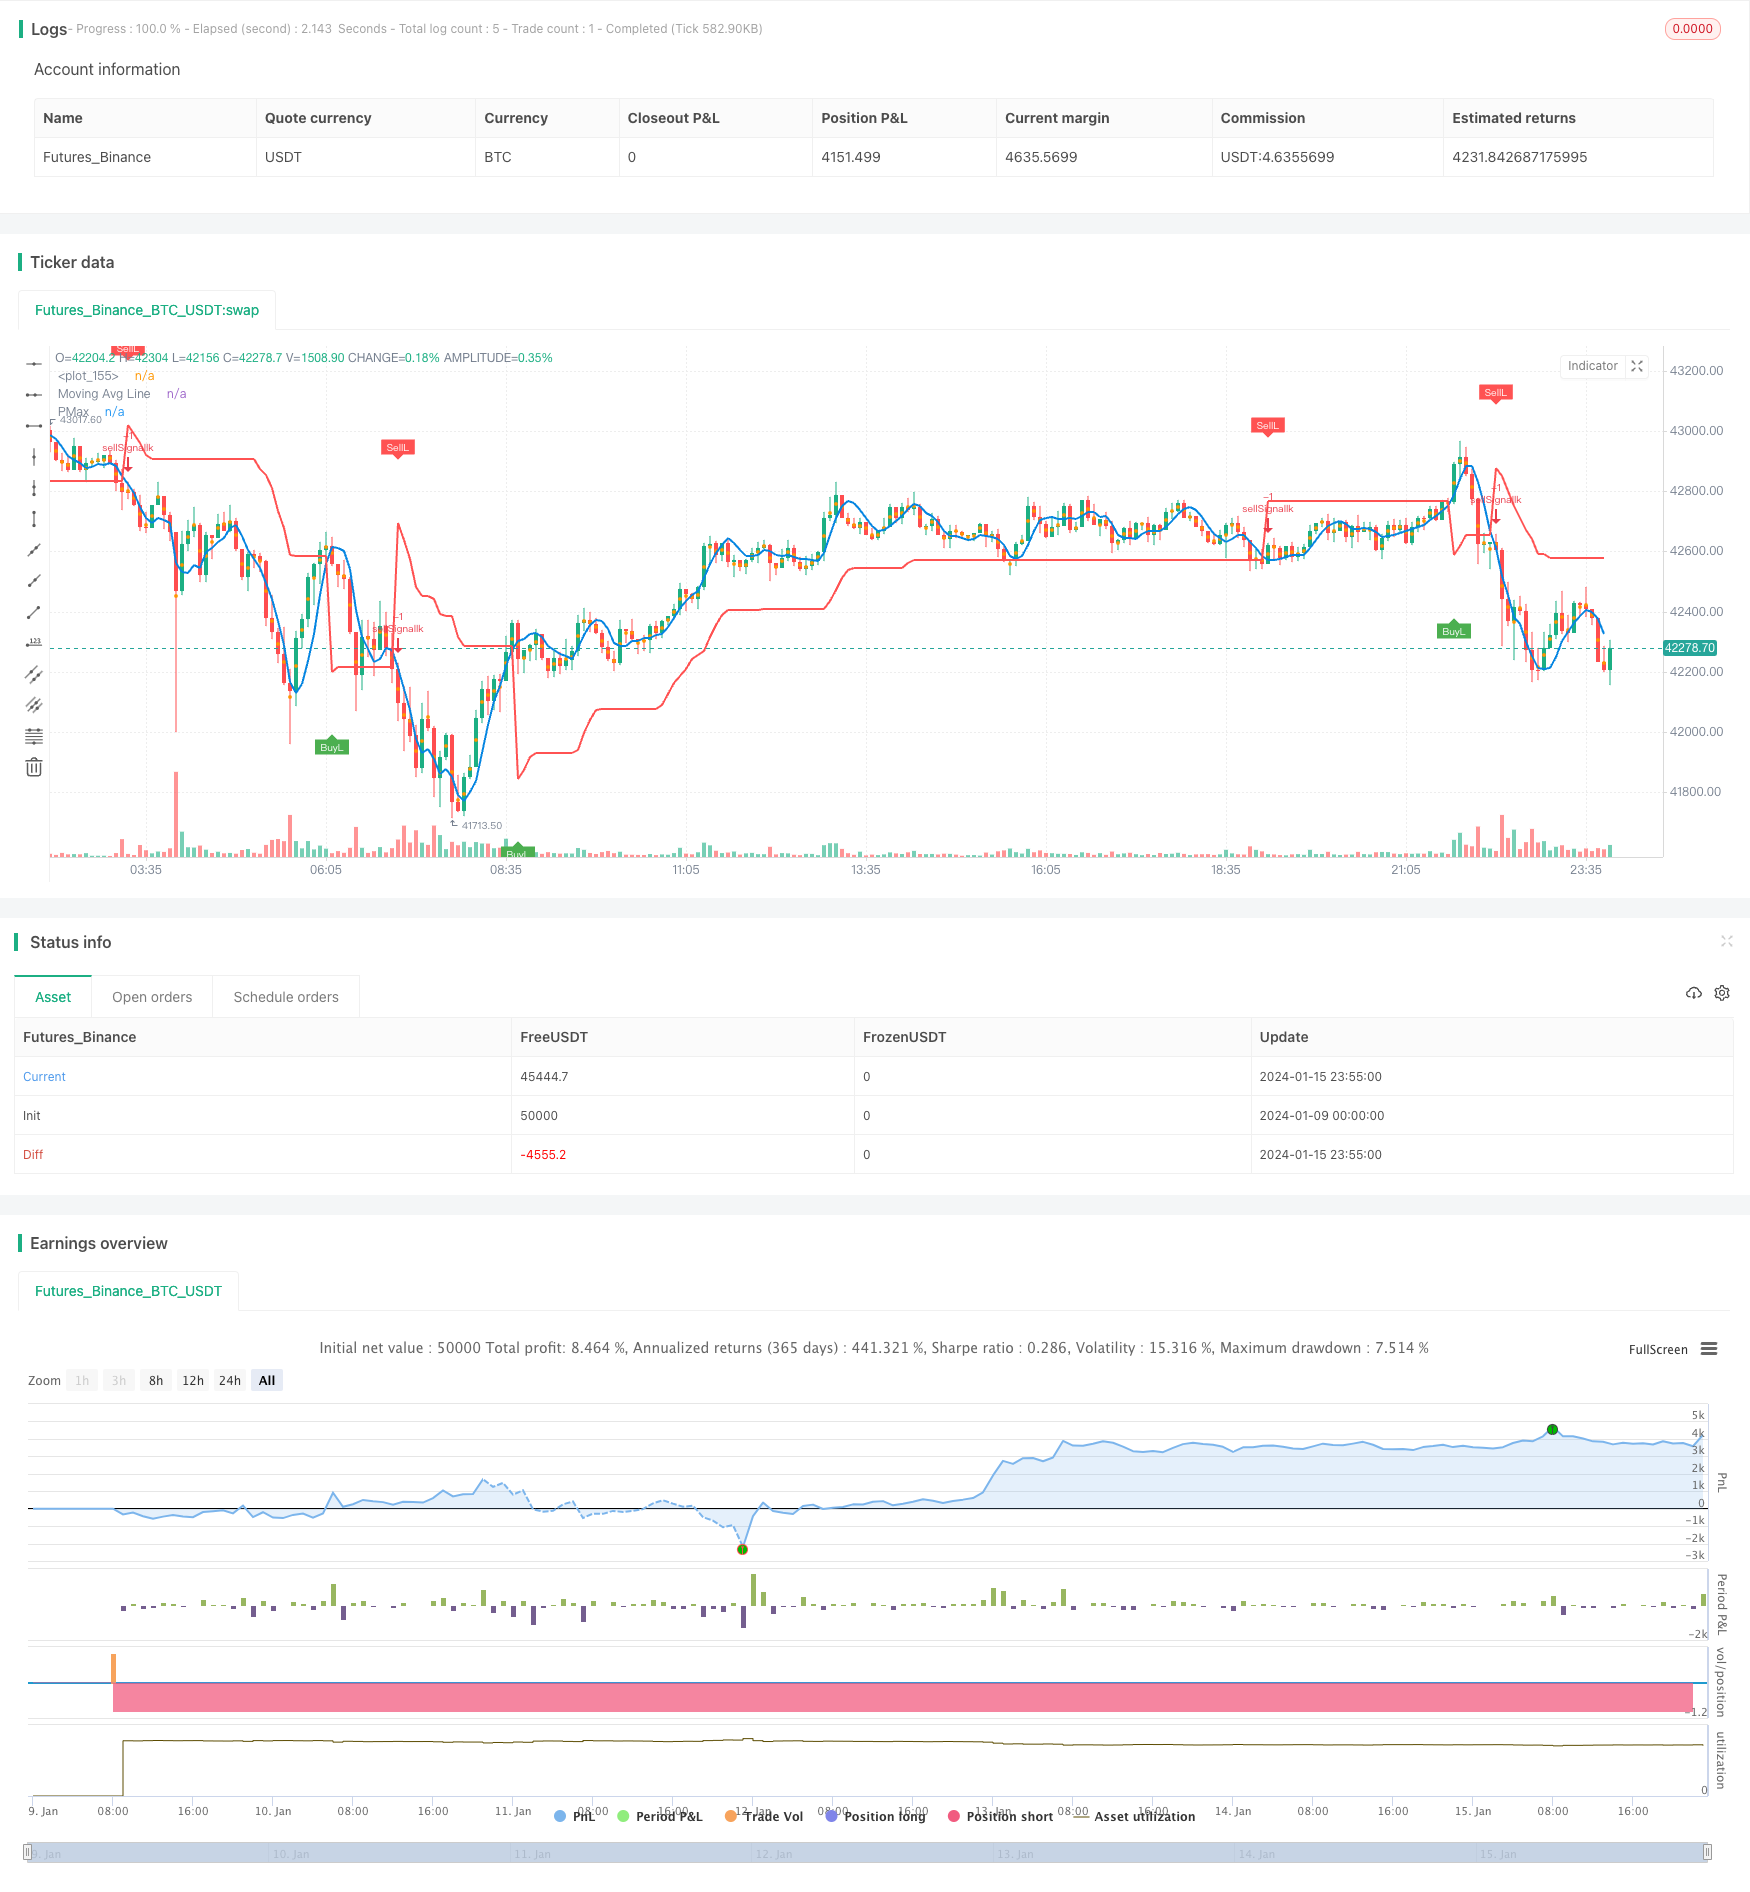
概述
动量突破优化策略是基于动量指标实现交易信号生成和止损止盈设置的趋势跟踪策略。该策略通过计算价格与移动均线的交叉情况判断市场趋势方向,结合ATR和LinReg通道构建动态止损机制。同时,策略还利用CMO指标识别超买超卖情况,实现更好的入场。
策略原理
- 1. 计算价格的ZLEMA移动平均线作为判断趋势方向的技术指标
- 2. 根据ATR计算长仓止损价位和短仓止损价位
- 3. 计算CMO指标判断超买超卖区间,与移动平均线结合作为进场信号
- 4. 根据ATR和移动平均线的突破构建三组交易信号
- 移动均线和止损价位的交叉信号
- 价格和止损价位的交叉信号
- 价格和移动平均线的交叉信号
- 5. 通过参数设置控制不同类型信号的启用
- 6. 设置风险系数和头寸控制进行风险管理
整个策略通过多种指标的组合应用实现稳定的趋势跟踪和自动止损,既保证了足够的交易机会,又控制了交易风险。
优势分析
多种指标组合使用
策略运用了移动平均线、ATR、CMO等多种指标的组合,指标之间可以形成有效的互补,识别趋势方向和超买超卖区域的判断更加准确可靠。
动态 trailing stop
基于ATR的动态止损机制,可以根据市场波动度灵活调整止损位置,有效控制单笔损失。
完善的风险管理
策略提供了头寸控制和风险系数设置,可以预先定义最大损失资金比例,避免资金大幅波动。
丰富的交易信号
策略总共提供三套交易信号,可以通过选择启用不同类型的信号组合,获得更好的回测结果。
风险分析
交易频率过高
启用全部信号组合时,可能会出现交易频率过高的情况。可以通过只选择部分信号组合使用来避免。
指标参数敏感
多种指标组合使用使得参数选择更加复杂,对参数设置更加敏感,需要精心测试参数的最优组合。
突破信号回撤率大
仅基于价格和止损价位交叉的交易信号,其止损范围较大,可能导致较大的单笔损失和回撤。可以选择移动均线信号与其组合使用。
优化方向
测试不同参数组合
优化移动平均线类型、长度参数;优化ATR周期参数;优化CMO参数。找到参数的最优匹配。
优化信号使用策略
测试只使用移动平均线信号、止损价位信号以及组合信号,分析最佳使用策略。
测试在不同品种的表现
在股指、外汇、商品品种进行回测,分析策略对市场类型的适应性。
总结
本策略综合运用多种指标识别趋势方向、构建止损机制、发现超买超卖机会。通过参数优化、信号组合选择等方法进行调整,可以获得较好的回撤指标。整体来说,该策略体系完整,可靠性较高,值得进一步在实盘中测试优化。
策略源码
/*backtest
start: 2024-01-09 00:00:00
end: 2024-01-16 00:00:00
period: 5m
basePeriod: 1m
exchanges: [{"eid":"Futures_Binance","currency":"BTC_USDT"}]
*/

//@version=4
// This source code is subject to the terms of the Mozilla Public License 2.0 at https://mozilla.org/MPL/2.0/
// © KivancOzbilgic
//developer: @KivancOzbilgic
//author: @KivancOzbilgic

strategy(title="Profit Maximizer PMax", overlay=true,
     pyramiding=0, initial_capital=1000,
     commission_type=strategy.commission.cash_per_order,
     commission_value=0.025, slippage=2)


src = input(hl2, title="Source")
Periods = input(title="ATR Length", type=input.integer, defval=10)
Multiplier = input(title="ATR Multiplier", type=input.float, step=0.1, defval=3.0)
mav = input(title="Moving Average Type", defval="ZLEMA", options=["SMA", "EMA", "WMA", "TMA", "VAR", "WWMA", "ZLEMA", "TSF"])
length =input(10, "Moving Average Length", minval=1)
changeATR= input(title="Change ATR Calculation Method ?", type=input.bool, defval=true)
showsupport = input(title="Show Moving Average?", type=input.bool, defval=true)
showsignalsk = input(title="Show Crossing Signals?", type=input.bool, defval=true)
showsignalsc = input(title="Show Price/Pmax Crossing Signals?", type=input.bool, defval=false)
highlighting = input(title="Highlighter On/Off ?", type=input.bool, defval=true)

usePosSize = input(title="Use Position Sizing?", type=input.bool, defval=true)
riskPerc   = input(title="Risk %", type=input.float, defval=0.5, step=0.25)

// Make input options that configure backtest date range
startDate = input(title="Start Date", type=input.integer,
     defval=1, minval=1, maxval=31)
startMonth = input(title="Start Month", type=input.integer,
     defval=1, minval=1, maxval=12)
startYear = input(title="Start Year", type=input.integer,
     defval=2019, minval=1800, maxval=2100)

endDate = input(title="End Date", type=input.integer,
     defval=1, minval=1, maxval=31)
endMonth = input(title="End Month", type=input.integer,
     defval=12, minval=1, maxval=12)
endYear = input(title="End Year", type=input.integer,
     defval=2021, minval=1800, maxval=2100)

// Look if the close time of the current bar
// falls inside the date range
inDateRange = true

atr2 = sma(tr, Periods)
atr= changeATR ? atr(Periods) : atr2
valpha=2/(length+1)
vud1=src>src[1] ? src-src[1] : 0
vdd1=src<src[1] ? src[1]-src : 0
vUD=sum(vud1,9)
vDD=sum(vdd1,9)
vCMO=nz((vUD-vDD)/(vUD+vDD))
VAR=0.0
VAR:=nz(valpha*abs(vCMO)*src)+(1-valpha*abs(vCMO))*nz(VAR[1])
wwalpha = 1/ length
WWMA = 0.0
WWMA := wwalpha*src + (1-wwalpha)*nz(WWMA[1])
zxLag = length/2==round(length/2) ? length/2 : (length - 1) / 2
zxEMAData = (src + (src - src[zxLag]))
ZLEMA = ema(zxEMAData, length)
lrc = linreg(src, length, 0)
lrc1 = linreg(src,length,1)
lrs = (lrc-lrc1)
TSF = linreg(src, length, 0)+lrs
getMA(src, length) =>
    ma = 0.0
    if mav == "SMA"
        ma := sma(src, length)
        ma

    if mav == "EMA"
        ma := ema(src, length)
        ma

    if mav == "WMA"
        ma := wma(src, length)
        ma

    if mav == "TMA"
        ma := sma(sma(src, ceil(length / 2)), floor(length / 2) + 1)
        ma

    if mav == "VAR"
        ma := VAR
        ma

    if mav == "WWMA"
        ma := WWMA
        ma

    if mav == "ZLEMA"
        ma := ZLEMA
        ma

    if mav == "TSF"
        ma := TSF
        ma
    ma

MAvg=getMA(src, length)
longStop = MAvg - Multiplier*atr
longStopPrev = nz(longStop[1], longStop)
longStop := MAvg > longStopPrev ? max(longStop, longStopPrev) : longStop
shortStop = MAvg + Multiplier*atr
shortStopPrev = nz(shortStop[1], shortStop)
shortStop := MAvg < shortStopPrev ? min(shortStop, shortStopPrev) : shortStop
dir = 1
dir := nz(dir[1], dir)
dir := dir == -1 and MAvg > shortStopPrev ? 1 : dir == 1 and MAvg < longStopPrev ? -1 : dir
PMax = dir==1 ? longStop: shortStop
plot(showsupport ? MAvg : na, color=#0585E1, linewidth=2, title="Moving Avg Line")
pALL=plot(PMax, color=color.red, linewidth=2, title="PMax", transp=0)

alertcondition(cross(MAvg, PMax), title="Cross Alert", message="PMax - Moving Avg Crossing!")
alertcondition(crossover(MAvg, PMax), title="Crossover Alarm", message="Moving Avg BUY SIGNAL!")
alertcondition(crossunder(MAvg, PMax), title="Crossunder Alarm", message="Moving Avg SELL SIGNAL!")
alertcondition(cross(src, PMax), title="Price Cross Alert", message="PMax - Price Crossing!")
alertcondition(crossover(src, PMax), title="Price Crossover Alarm", message="PRICE OVER PMax - BUY SIGNAL!")
alertcondition(crossunder(src, PMax), title="Price Crossunder Alarm", message="PRICE UNDER PMax - SELL SIGNAL!")


// Calculate position size
riskEquity  = (riskPerc / 100) * strategy.equity
atrCurrency = (atr(20) * syminfo.pointvalue)
posSize     = usePosSize ? floor(riskEquity / atrCurrency) : 1

//Long
buySignalk = crossover(MAvg, PMax)
plotshape(buySignalk and showsignalsk ? PMax*0.995 : na, title="Buy", text="BuyL", location=location.absolute, style=shape.labelup, size=size.tiny, color=color.green, textcolor=color.white, transp=0)


if(buySignalk and showsignalsk and inDateRange)
    strategy.entry(id="buySignalk", long=true, qty=posSize)

sellSignallk = crossunder(MAvg, PMax)
plotshape(sellSignallk and showsignalsk ? PMax*1.005 : na, title="Sell", text="SellL", location=location.absolute, style=shape.labeldown, size=size.tiny, color=color.red, textcolor=color.white, transp=0)

if(sellSignallk and showsignalsk and inDateRange)
    strategy.order(id="sellSignallk", long=false, qty=strategy.position_size)

//Short
buySignalc = crossover(src, PMax)
plotshape(buySignalc and showsignalsc ? PMax*0.995 : na, title="Buy", text="BuyS", location=location.absolute, style=shape.labelup, size=size.tiny, color=#0F18BF, textcolor=color.white, transp=0)

if(buySignalc and showsignalsc and inDateRange)
    strategy.entry(id="BuyS", long=false, qty=posSize)

sellSignallc = crossunder(src, PMax)
plotshape(sellSignallc and showsignalsc ? PMax*1.005 : na, title="Sell", text="SellS", location=location.absolute, style=shape.labeldown, size=size.tiny, color=#0F18BF, textcolor=color.white, transp=0)

if(sellSignallc and showsignalsc and inDateRange)
    strategy.order(id="SellS", long=true, qty=abs(strategy.position_size))

mPlot = plot(ohlc4, title="", style=plot.style_circles, linewidth=0,display=display.none)

longFillColor = highlighting ? (MAvg>PMax ? color.green : na) : na
shortFillColor = highlighting ? (MAvg<PMax ? color.red : na) : na

fill(mPlot, pALL, title="UpTrend Highligter", color=longFillColor)
fill(mPlot, pALL, title="DownTrend Highligter", color=shortFillColor)

// Exit open market position when date range ends
if (not inDateRange)
    strategy.close_all()