Dual Moving Average Golden Cross Strategy

Overview
The Dual Moving Average Golden Cross strategy is a quantitative trading strategy based on moving averages. By calculating moving averages of different periods, it judges market trends and trading opportunities. When the short-term moving average crosses above the long-term moving average, a golden cross is formed as a buy signal. When the short-term moving average crosses below the long-term moving average, a death cross is formed as a sell signal.
Strategy Logic
The core logic of the Dual Moving Average Golden Cross strategy lies in the smoothing characteristics of moving averages. Moving averages can effectively filter market noise and indicate general trend directions. The short-term moving average is more sensitive to price changes, capturing price fluctuation information over the recent period. The long-term moving average responds more slowly to recent price changes, reflecting the long-term trend of the market. When the short-term moving average crosses above the long-term moving average, it indicates the market is forming a new uptrend. When the short-term moving average crosses below the long-term moving average, it suggests the uptrend may be ending and one should consider exiting positions.
Another key point of the dual moving average strategy is the RSI indicator. RSI can effectively determine whether the market is in overbought or oversold status. By incorporating RSI, it avoids generating wrong trading signals around market turning points. This strategy will only generate buy and sell signals when RSI meets the criteria.
Specifically, the trading logic is as follows:
- Calculate the 20-, 50-, and 100-period moving averages
- Check if the 20-period moving average crosses above the 50- and 100-period moving averages, indicating a potential uptrend
- Also check if RSI is below 50, suggesting not in overbought status
- If all 3 criteria are met, generate a buy signal
- Check if the 20-period moving average crosses below the 50- and 100-period moving averages, indicating a potential downtrend
- Also check if RSI exceeds 48.5, suggesting not in oversold status
- If all 3 criteria are met, generate a sell signal
By combining multiple parameters, this strategy can effectively filter false signals and improve accuracy of trading decisions.
Advantages
The Dual Moving Average Golden Cross strategy has the following advantages:
- The strategy logic is simple and clear, easy to understand and implement
- The parameters are flexible for optimization by adjusting moving average periods to fit different markets
- The combination of moving averages and RSI can effectively filter noise and evaluate real market trends
- Backtests show this strategy offers steady returns and smaller drawdowns
- The strategy can be further optimized with machine learning and other advanced techniques
Risks
The risks associated with this strategy include:
- Moving averages may lag during violent market swings, missing best entry and exit points
- Strategy performance depends heavily on parameter optimization
- Market regime changes over long term may necessitate adjustment of parameters
- Mechanical trading systems can result in concentrated positions and higher risk around turning points
To mitigate risks, optimizations can be made in the following aspects:
- Incorporate volatility metrics to dynamically adjust moving average periods based on market fluctuation frequency and magnitude
- Add machine learning models to dynamically optimize parameters
- Set stop loss limits to contain downside on individual trades
- Adopt position sizing schemes to reduce risks associated with concentrated positions
Enhancement Opportunities
There is room for further enhancement for the Dual Moving Average Golden Cross strategy:
- Incorporate additional filters like volume, Bollinger Bands to improve stability
- Apply machine learning techniques to auto-tune parameters and increase adaptiveness
- Design adaptive schemes for adjusting moving average periods based on evolving market landscapes
- Incorporate advanced risk management systems to dynamically size positions to match risk appetite
- Construct algos ensemble systems with multiple models to improve robustness
Conclusion
The Dual Moving Average Golden Cross strategy is a classic rule-based quantitative trading strategy. It’s easy to implement with flexible parameter tuning and good backtested results. It serves as a great starting point for novice quants. However, it has some intrinsic limitations. With further research and optimization, it can be enhanced into more intelligent and stable systems for sustained profitability.
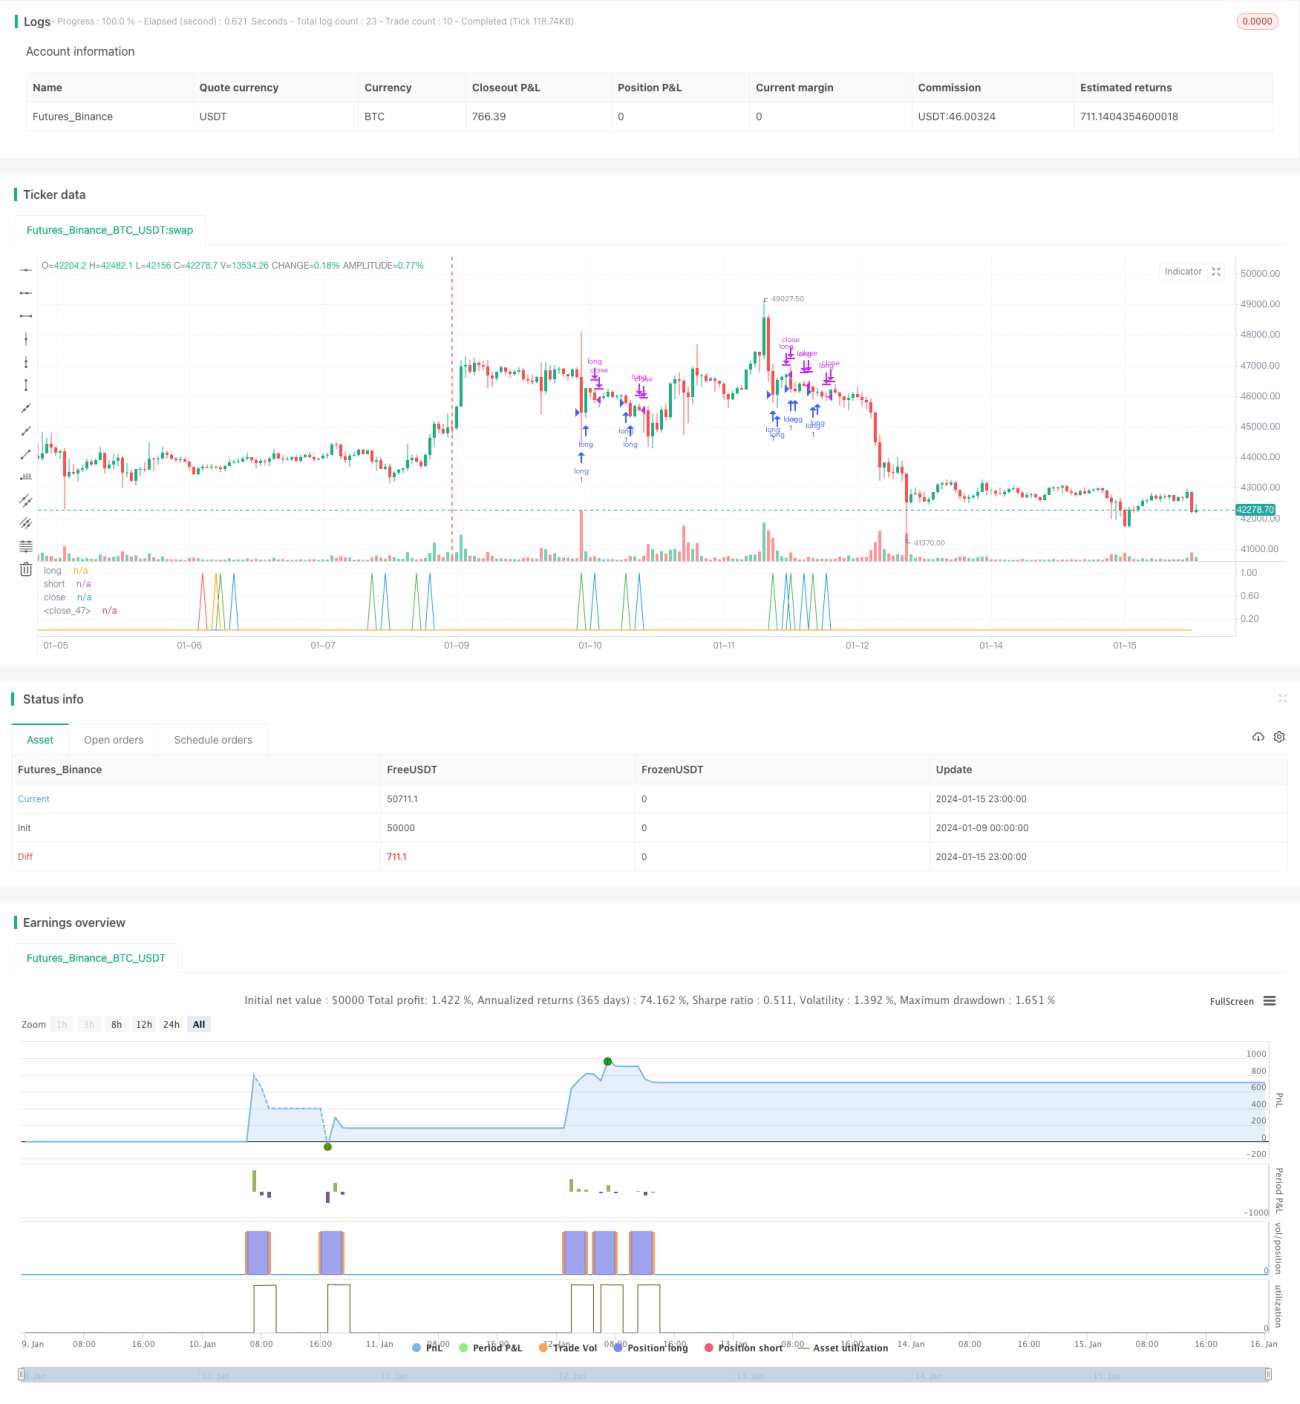
/*backtest
start: 2024-01-09 00:00:00
end: 2024-01-16 00:00:00
period: 1h
basePeriod: 15m
exchanges: [{"eid":"Futures_Binance","currency":"BTC_USDT"}]
*/

//@version=4
//Based on Larry Connors RSI-2 Strategy - Lower RSI
strategy(title="EA_3Minute_MagnetStrat", shorttitle="EA_3Minute_MagnetStrat", overlay=false)
src = close, - 1