概述
这个策略运用了移动平均线、价格形态和交易量的组合来识别市场的反转点。当快速移动平均线上穿慢速移动平均线、并且出现多头吞噬形态、突破阻力位、交易量放大时,策略会做多;相反,当快速移动平均线下穿慢速移动平均线、并且出现空头吞噬形态、跌破支撑位、交易量放大时,策略会做空。
原理
这个策略的核心思想是利用均线系统、价格形态和量能三者的组合来识别潜在的反转点。具体来说,均线的黄金交叉和死亡交叉可以判断趋势的转换。多头吞噬和空头吞噬这两种价格形态通常预示着短期反转。大量的交易量涌入也往往意味着即将出现的趋势反转。这三个信号的组合使用可以相对准确地把握住反转的时机。
从代码逻辑上看,首先计算快速移动平均线和慢速移动平均线。然后设置多头吞噬和空头吞噬的判断条件。同时还设置了支持阻力位和交易量放大的条件。满足均线黄金交叉、多头吞噬形态、突破阻力位和交易量放大时,发出做多信号;满足均线死亡交叉、空头吞噬形态、跌破支持位和交易量放大时,发出平仓信号。
优势
这个策略最大的优势在于利用多种信号的组合来识别反转,这可以有效减少假信号。具体来说,仅仅依靠单一的均线、价格形态或者量能很容易造成错误的交易信号。但是如果三者同时出现信号,那么预测反转的成功率会大大提高。
另外,这个策略同时利用了趋势和反转两个因素。在出现反转信号之前,必须先有趋势的存在。也就是说,这个策略只会在趋势背景下寻找反转机会。这也降低了随机性,提高了盈利概率。
风险
这个策略最大的风险在于反转失败,即发出做多信号后,价格继续向下;或者发出做空信号后,价格继续上涨。这通常是由于判断失误,反转信号只是个假象,或者只是短期的调整,之后继续原有趋势。
解决方法就是调整均线参数,识别更长周期的趋势;同时适当放大止损幅度,在反转失败后及时止损。此外,也可以结合更多因素来确认反转,比如请大周期的价格形态等。
优化
这个策略可以通过以下几个方面来进行优化:
调整均线参数,识别更合适的长短周期。
测试不同的支持阻力位算法,如帕累托支撑阻力位。
尝试不同的交易量指标,如能量潮指标、交易量摆动指标等。
增加更多确认反转的信号,如长周期价格形态、成交量的剧烈放大等。
结合股指期货来进行跨市场确认,利用股指期货来确认个股的反转。
通过测试不同的参数组合,这个策略可以进一步优化,从而提高盈利率和胜率。
总结
这个策略整合了均线系统、价格形态和交易量三个因素来识别反转,实现了多种信号的有效结合。它只在趋势的背景下寻找反转机会,避免了随机交易。通过进一步优化参数以及增加确认因素,这个策略可以成为一个非常实用的短线反转策略。
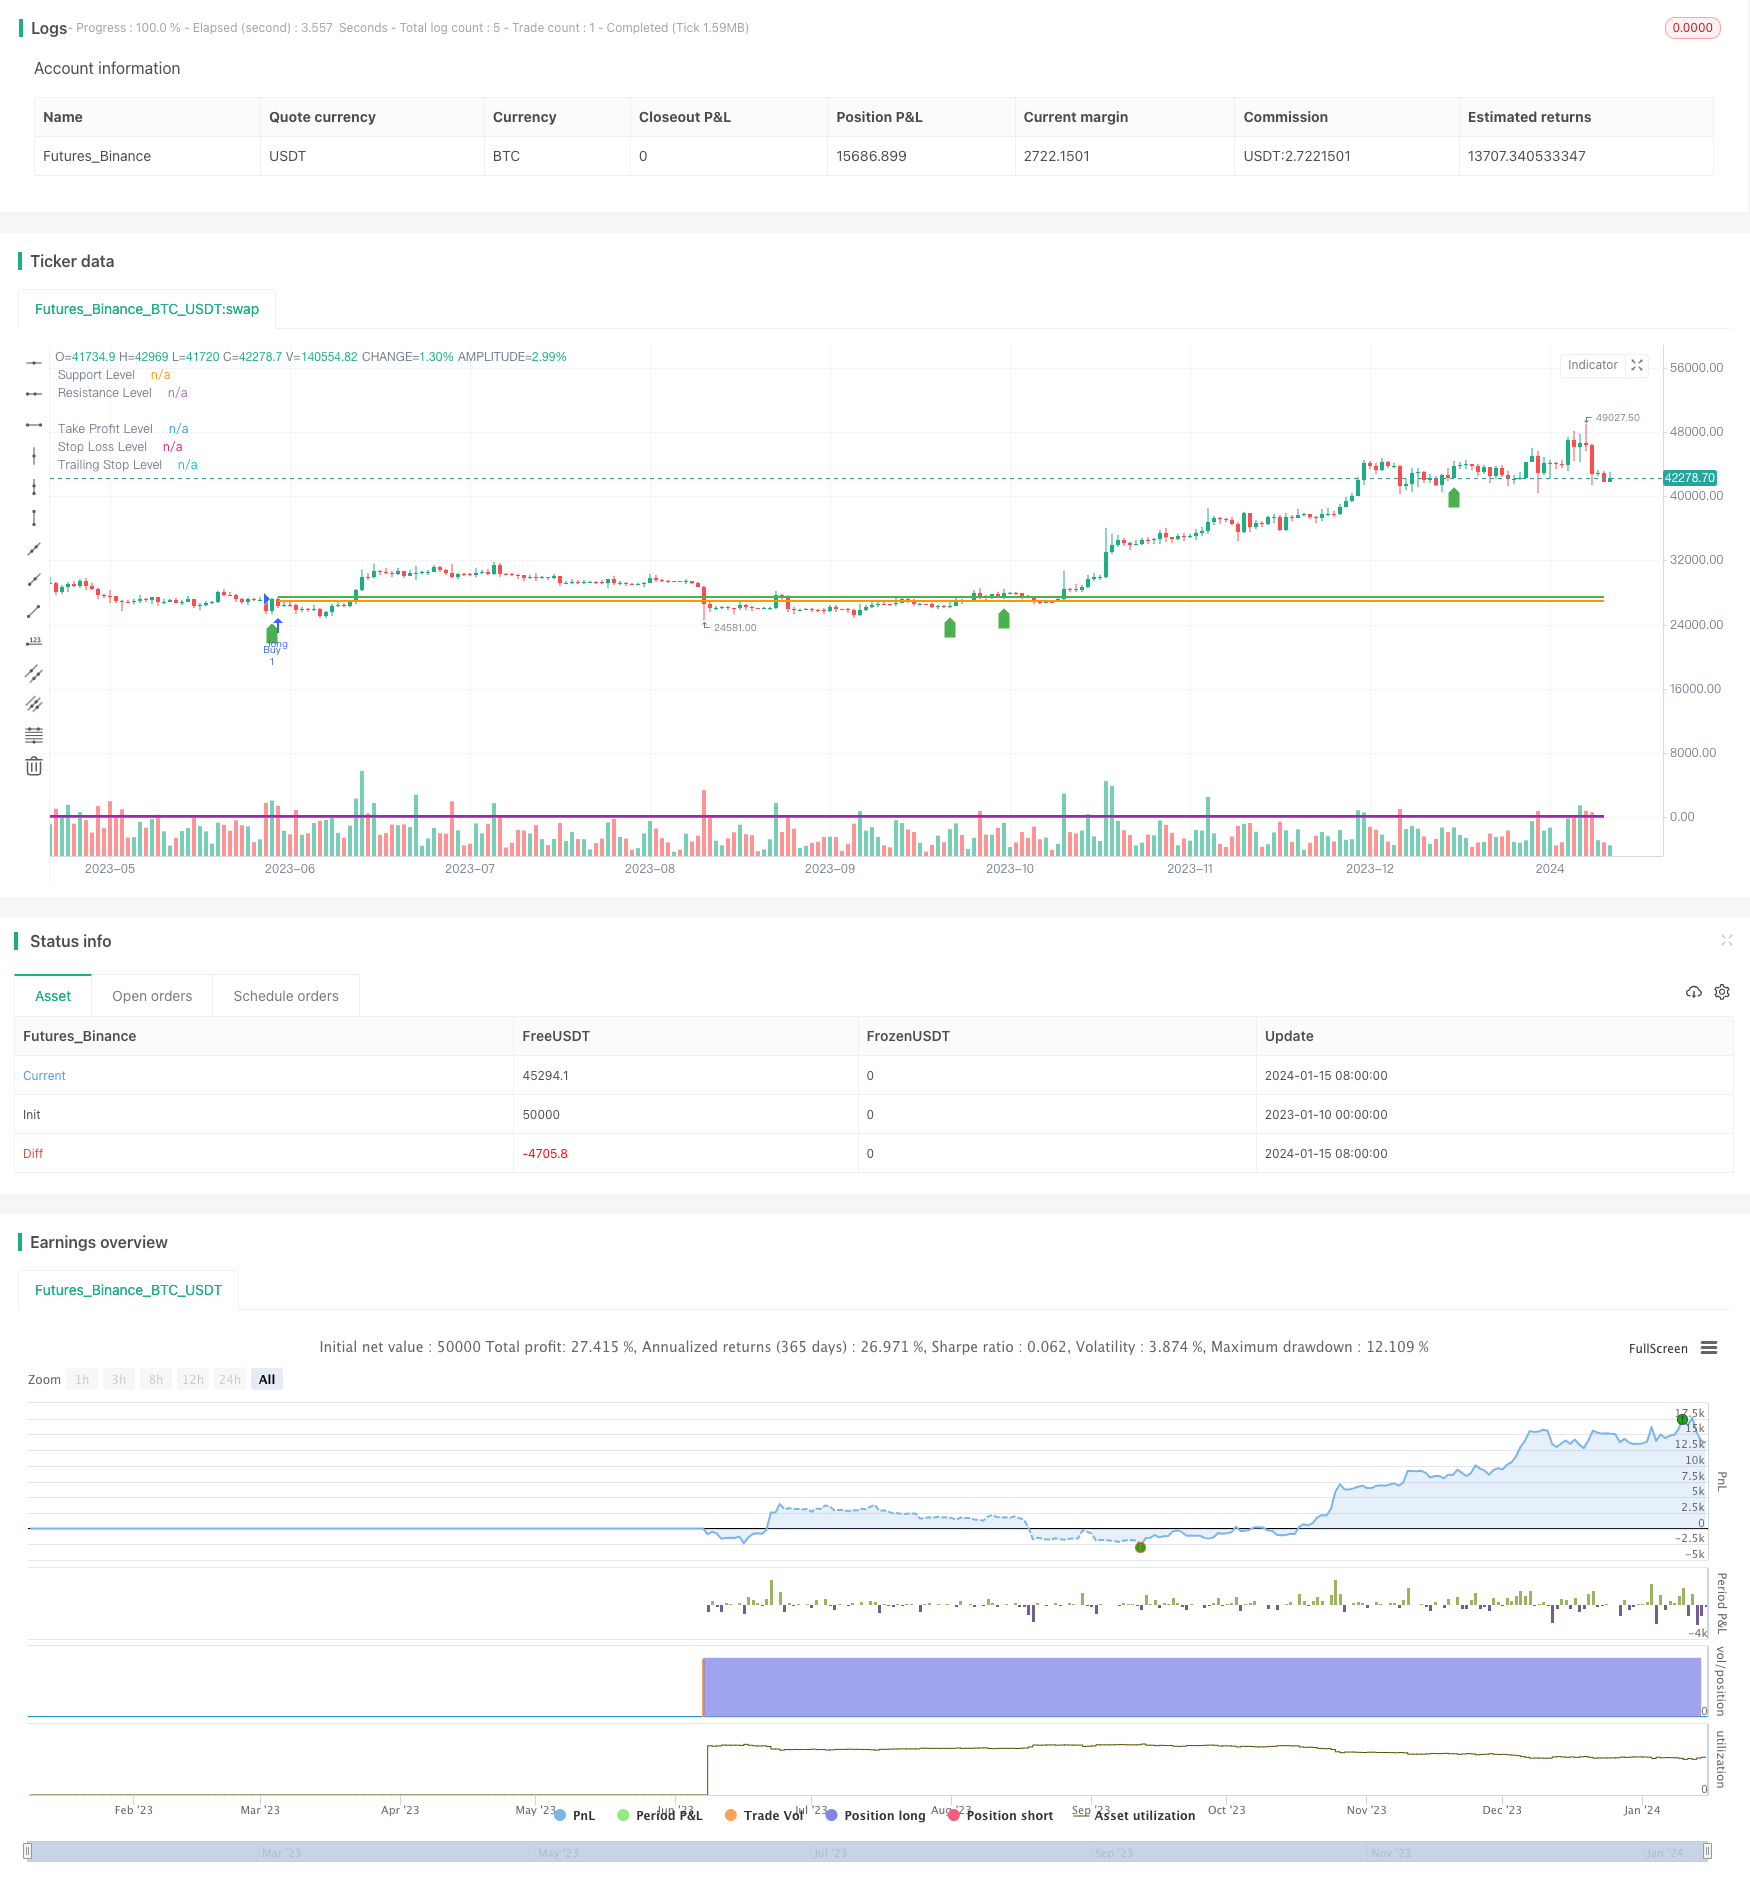
/*backtest
start: 2023-01-10 00:00:00
end: 2024-01-16 00:00:00
period: 1d
basePeriod: 1h
exchanges: [{"eid":"Futures_Binance","currency":"BTC_USDT"}]
*/

//@version=5
strategy("Profit Table Strategy", overlay=true)

// Input parameters
fastLength = input(10, title="Fast MA Length")
slowLength = input(20, title="Slow MA Length")
takeProfitPercent = input(1, title="Take Profit (%)") / 100
stopLossPercent = input(1, title="Stop Loss (%)") / 100
trailingStopPercent = input(1, title="Trailing Stop (%)") / 100

// Price action conditions
bullishEngulfing = close > open and close > open[1] and open < close[1] and open[1] > close[1]
bearishEngulfing = close < open and close < open[1] and open > close[1] and open[1] < close[1]

// Support and resistance levels
supportLevel = input(100, title="Support Level")
resistanceLevel = input(200, title="Resistance Level")

// Volume conditions
volumeCondition = volume > ta.sma(volume, 20)

// Calculate moving averages
fastMA = ta.sma(close, fastLength)
slowMA = ta.sma(close, slowLength)

// Buy condition
buyCondition = (fastMA > slowMA) and (close > resistanceLevel) and bullishEngulfing and volumeCondition

// Sell condition
sellCondition = (fastMA < slowMA) and (close < supportLevel) and bearishEngulfing and volumeCondition

// Strategy logic
strategy.entry("Buy", strategy.long, when=buyCondition)
strategy.close("Buy", when=sellCondition)

// Calculate take profit, stop loss, and trailing stop levels
takeProfitLevel = strategy.position_avg_price * (1 + takeProfitPercent)
stopLossLevel = strategy.position_avg_price * (1 - stopLossPercent)
trailingStopLevel = strategy.position_avg_price * (1 - trailingStopPercent)

// Plotting levels on the chart
plot(supportLevel, color=color.blue, style=plot.style_line, linewidth=2, title="Support Level")
plot(resistanceLevel, color=color.purple, style=plot.style_line, linewidth=2, title="Resistance Level")
plot(takeProfitLevel, color=color.green, style=plot.style_line, linewidth=2, title="Take Profit Level")
plot(stopLossLevel, color=color.red, style=plot.style_line, linewidth=2, title="Stop Loss Level")
plot(trailingStopLevel, color=color.orange, style=plot.style_line, linewidth=2, title="Trailing Stop Level")

// Plotting buy and sell signals on the chart
plotshape(series=buyCondition, title="Buy Signal", color=color.green, style=shape.labelup, location=location.belowbar)
plotshape(series=sellCondition, title="Sell Signal", color=color.red, style=shape.labeldown, location=location.abovebar)