概述
该策略的主要思想是在短期下跌结束后定期追踪低位均价。具体来说,策略会在每月底识别短期下跌结束的时机,于是定期追加仓位;同时在最后一个K线收盘时清仓离场。
策略原理
- 定期追踪信号判定:每过24*30根K线(表示一个月)后,判定为到达定期追踪点,输出首个信号。
- 短期下跌结束判定:使用MACD指标判断趋势,当MACD背离并下穿信号线时,认为短期下跌结束。
- 入场规则:同时满足定期追踪信号和短期下跌结束信号时,释放追踪信号,开仓做多。
- 出场规则:当最后一个K线收盘时,清仓全部头寸。
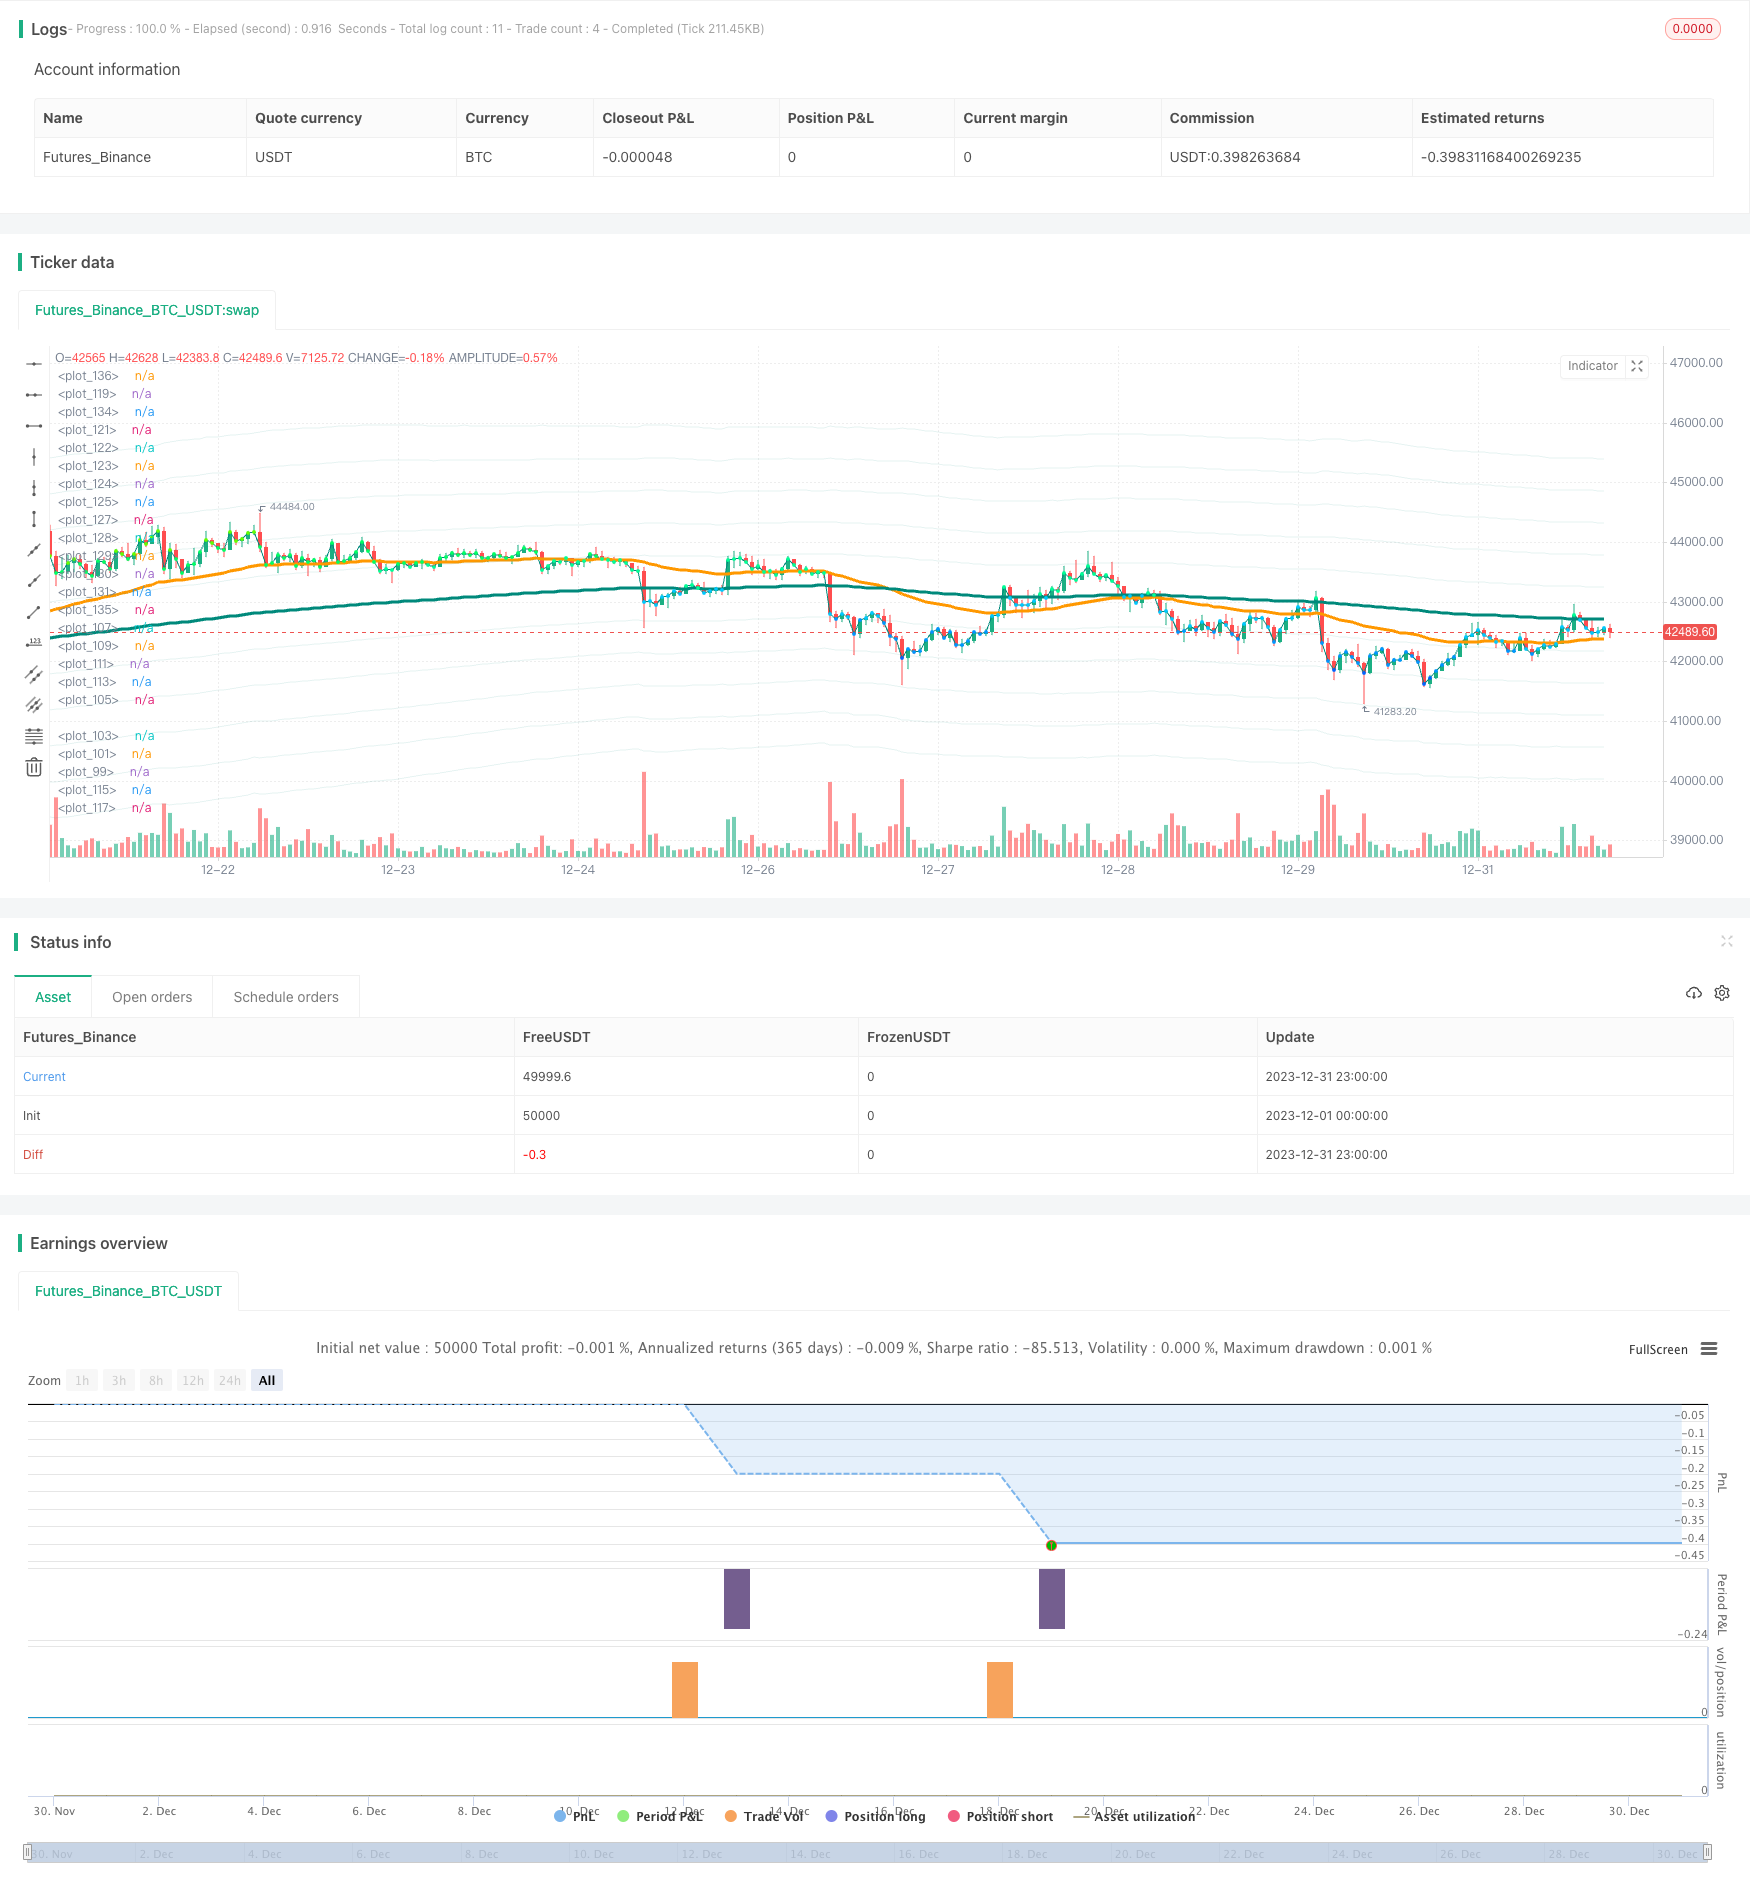
以上就是策略的基本交易流程和原理。值得注意的是,策略默认使用1000美元的资金追踪每月,在 backtest 中将扩展至33个月,即总共投入33000美元。
优势分析
该策略最大的优势在于能够在低位定期建仓,从长期来看能获得比较优惠的买入成本,产生比较高的收益率。另外使用MACD指标识别短期买点也比较可靠和清晰,不会误入死胡同,这也可以在一定程度上避免损失。
总的来说,这是一种成本均价的策略,比较适合中长线持有者定期分批买入,可以获得比较满意的回报收益。
风险及解决方法
策略的主要风险在于无法准确判断短期下跌的结束点,MACD指标判断下跌结束的时机可能有滞后,这会导致成本无法在最优点买入。另外资金分散投入也增加了操作成本。
可以考虑加入更多指标以判断趋势,如布林线,KDJ等,这些指标可以提前判断反转的时机。同时可以优化每月投入资金的数额,来降低操作成本对收益的影响。
优化方向
可以从以下几个方向进一步优化该策略:
优化定期追踪的时间周期,如改为每两个月定期追踪一次等,减少过于频繁交易的问题。
结合更多指标判断短期下跌结束的时机,使买入点更加接近最低点。
对每月投入资金数量进行优化,找到最优配置。
尝试将止损策略融入其中,避免下跌过深造成损失。
测试不同持仓周期对收益的影响,找到最优持仓天数。
总结
该定期追踪低谷均价策略整体思路清晰易懂,通过定期追加和短期判断结合,可以获得较优惠的成本价。中长线持有该策略可以获得稳定的收益,适合追求长期投资价值的投资者。同时也存在一些可以优化的方向,投入注意力从而进一步完善该策略,使其业绩能够更上一层楼。
策略源码
/*backtest
start: 2023-12-01 00:00:00
end: 2023-12-31 23:59:59
period: 1h
basePeriod: 15m
exchanges: [{"eid":"Futures_Binance","currency":"BTC_USDT"}]
*/

// This source code is subject to the terms of the Mozilla Public License 2.0 at https://mozilla.org/MPL/2.0/
// © BHD_Trade_Bot

// @version=5
strategy(
 shorttitle            = 'DCA After Downtrend v2',
 title                 = 'DCA After Downtrend v2 (by BHD_Trade_Bot)',
 overlay               = true,
 calc_on_every_tick    = false,
 calc_on_order_fills   = false,
 use_bar_magnifier     = false,
 pyramiding            = 1000,
 initial_capital       = 0,
 default_qty_type      = strategy.cash,
 default_qty_value     = 1000,
 commission_type       = strategy.commission.percent,
 commission_value      = 1.1)


// Backtest Time Period
start_year   = input(title='Start year'   ,defval=2017)
start_month  = input(title='Start month'  ,defval=1)
start_day    = input(title='Start day'    ,defval=1)
start_time   = timestamp(start_year, start_month, start_day, 00, 00)

end_year     = input(title='end year'     ,defval=2050)
end_month    = input(title='end month'    ,defval=1)
end_day      = input(title='end day'      ,defval=1)
end_time     = timestamp(end_year, end_month, end_day, 23, 59)

window() => time >= start_time and time <= end_time ? true : false
h1_last_bar = (math.min(end_time, timenow) - time)/1000/60/60 < 2


// EMA
ema50 = ta.ema(close, 50)
ema200 = ta.ema(close, 200)

// EMA_CD
emacd = ema50 - ema200
emacd_signal = ta.ema(emacd, 20)
hist = emacd - emacd_signal

// BHD Unit
bhd_unit = ta.rma(high - low, 200) * 2
bhd_upper = ema200 + bhd_unit
bhd_upper2 = ema200 + bhd_unit * 2
bhd_upper3 = ema200 + bhd_unit * 3
bhd_upper4 = ema200 + bhd_unit * 4
bhd_upper5 = ema200 + bhd_unit * 5

bhd_lower = ema200 - bhd_unit
bhd_lower2 = ema200 - bhd_unit * 2
bhd_lower3 = ema200 - bhd_unit * 3
bhd_lower4 = ema200 - bhd_unit * 4
bhd_lower5 = ema200 - bhd_unit * 5

// Count n candles after x long entries
var int nPastCandles = 0
var int entryNumber = 0
if window()
    nPastCandles := nPastCandles + 1


// ENTRY CONDITIONS

// 24 * 30 per month
entry_condition1 = nPastCandles > entryNumber * 24 * 30

// End of downtrend
entry_condition2 = emacd < 0 and hist < 0 and hist > hist[2]

ENTRY_CONDITIONS = entry_condition1 and entry_condition2


if ENTRY_CONDITIONS
    entryNumber := entryNumber + 1
    entryId = 'Long ' + str.tostring(entryNumber)
    strategy.entry(entryId, strategy.long)


// CLOSE CONDITIONS

// Last bar
CLOSE_CONDITIONS = barstate.islast or h1_last_bar

if CLOSE_CONDITIONS
    strategy.close_all()


// Draw
colorRange(src) =>
    if src > bhd_upper5
        color.rgb(255,0,0)
    else if src > bhd_upper4
        color.rgb(255,150,0)
    else if src > bhd_upper3
        color.rgb(255,200,0)
    else if src > bhd_upper2
        color.rgb(100,255,0)
    else if src > bhd_upper
        color.rgb(0,255,100)
    else if src > ema200
        color.rgb(0,255,150)
    else if src > bhd_lower
        color.rgb(0,200,255)
    else if src > bhd_lower2
        color.rgb(0,150,255)
    else if src > bhd_lower3
        color.rgb(0,100,255)
    else if src > bhd_lower4
        color.rgb(0,50,255)
    else
        color.rgb(0,0,255)

bhd_upper_line = plot(bhd_upper, color=color.new(color.teal, 90))
bhd_upper_line2 = plot(bhd_upper2, color=color.new(color.teal, 90))
bhd_upper_line3 = plot(bhd_upper3, color=color.new(color.teal, 90))
bhd_upper_line4 = plot(bhd_upper4, color=color.new(color.teal, 90))
bhd_upper_line5 = plot(bhd_upper5, color=color.new(color.teal, 90))

bhd_lower_line = plot(bhd_lower, color=color.new(color.teal, 90))
bhd_lower_line2 = plot(bhd_lower2, color=color.new(color.teal, 90))
bhd_lower_line3 = plot(bhd_lower3, color=color.new(color.teal, 90))
bhd_lower_line4 = plot(bhd_lower4, color=color.new(color.teal, 90))
bhd_lower_line5 = plot(bhd_lower5, color=color.new(color.teal, 90))
// fill(bhd_upper_line5, bhd_lower_line5, color=color.new(color.teal, 95))

plot(ema50, color=color.orange, linewidth=3)
plot(ema200, color=color.teal, linewidth=3)
plot(close, color=color.teal, linewidth=1)
plot(close, color=colorRange(close), linewidth=3, style=plot.style_circles)