概述
本策略通过计算OBV指标的MACD指标,判断OBV量能的趋势和转折点,以此驱动交易决策。其基本思路是当OBV的MACD柱形图从负数区域突破0轴线而进入正数区域时产生买入信号;而从正数区域跌破0轴线进入负数区域时产生卖出信号。
策略原理
本策略的核心指标是OBV的MACD指标。OBV指标可以反映股票的量能趋势,它通过统计一段时间内的收盘价变化方向和成交量变化关系,来判断是上涨量能增强还是减弱。MACD指标可以显示不同均线间的差值,反映价格变化的动量。所以,结合OBV量能指标和MACD动量指标,可以更清楚地判断量能的变化趋势。
具体来说,本策略首先计算OBV指标,它通过统计一段时间内收盘价变化方向和成交量的关系,计算出OBV量能线。然后,在OBV量能线的基础上计算其MACD指标,包含MACD线、信号线和histogram柱形图。最后,当macd histogram从负数区域突破0轴线向上进入正数区域时,产生买入信号;当柱形图从正数区域跌破0轴线进入负数区域时,产生卖出信号。
这样,通过MACD直观显示OBV量能的动量特征,判断量能的变化趋势,用MACD的突破来发出交易信号,可以提高交易决策的准确性。
优势分析
这种策略结合OBV量能分析和MACD动量指标,对量能变化和价格走势判断比较准确,可以有效过滤ALSE信号。具体优势有:
- OBV指标可以判断买卖双方力量对比和量能变化趋势
- MACD柱形图可以清晰识别OBV量能转折点
- 交易信号比较清晰,不易产生误判
- 可配置交易的参数较多,交易规则清晰
风险分析
该策略也存在一些风险,主要集中在以下几个方面:
- OBV和MACD都对交易量敏感,如果出现异常的高额成交量,会产生误导
- Parameters设置不当也会影响策略效果
- 多空转换时,OBV量能变化可能滞后,导致交易信号滞后
针对这些风险,可以采取以下措施加以应对:
- 对交易量进行过滤,剔除异常数据
- 谨慎设置参数,要考量市场环境
- 适当调整参数设置,如MACD周期,使交易信号及时
优化方向
本策略还有进一步优化的空间,主要方向有:
- 结合其他指标进行组合交易,提高策略效果
- 增加止损机制来控制风险
- 优化参数设置,使其更符合不同市场环境需要
通过不断测试和优化,本策略可以成为一个稳定而高效的量化交易策略。
总结
本策略是一种典型的结合量能分析和动量指标来判断价格趋势和发出交易信号的量化策略。它可以清晰识别出价格波动的转折点,交易信号比较可靠,在参数设定合理的前提下,可以获得较好的策略效果。但它也存在一些风险,需要通过不断优化来提高效果和降低风险。总的来说,本策略为量化交易策略提供了一种典型的思路,值得进一步研究和应用。
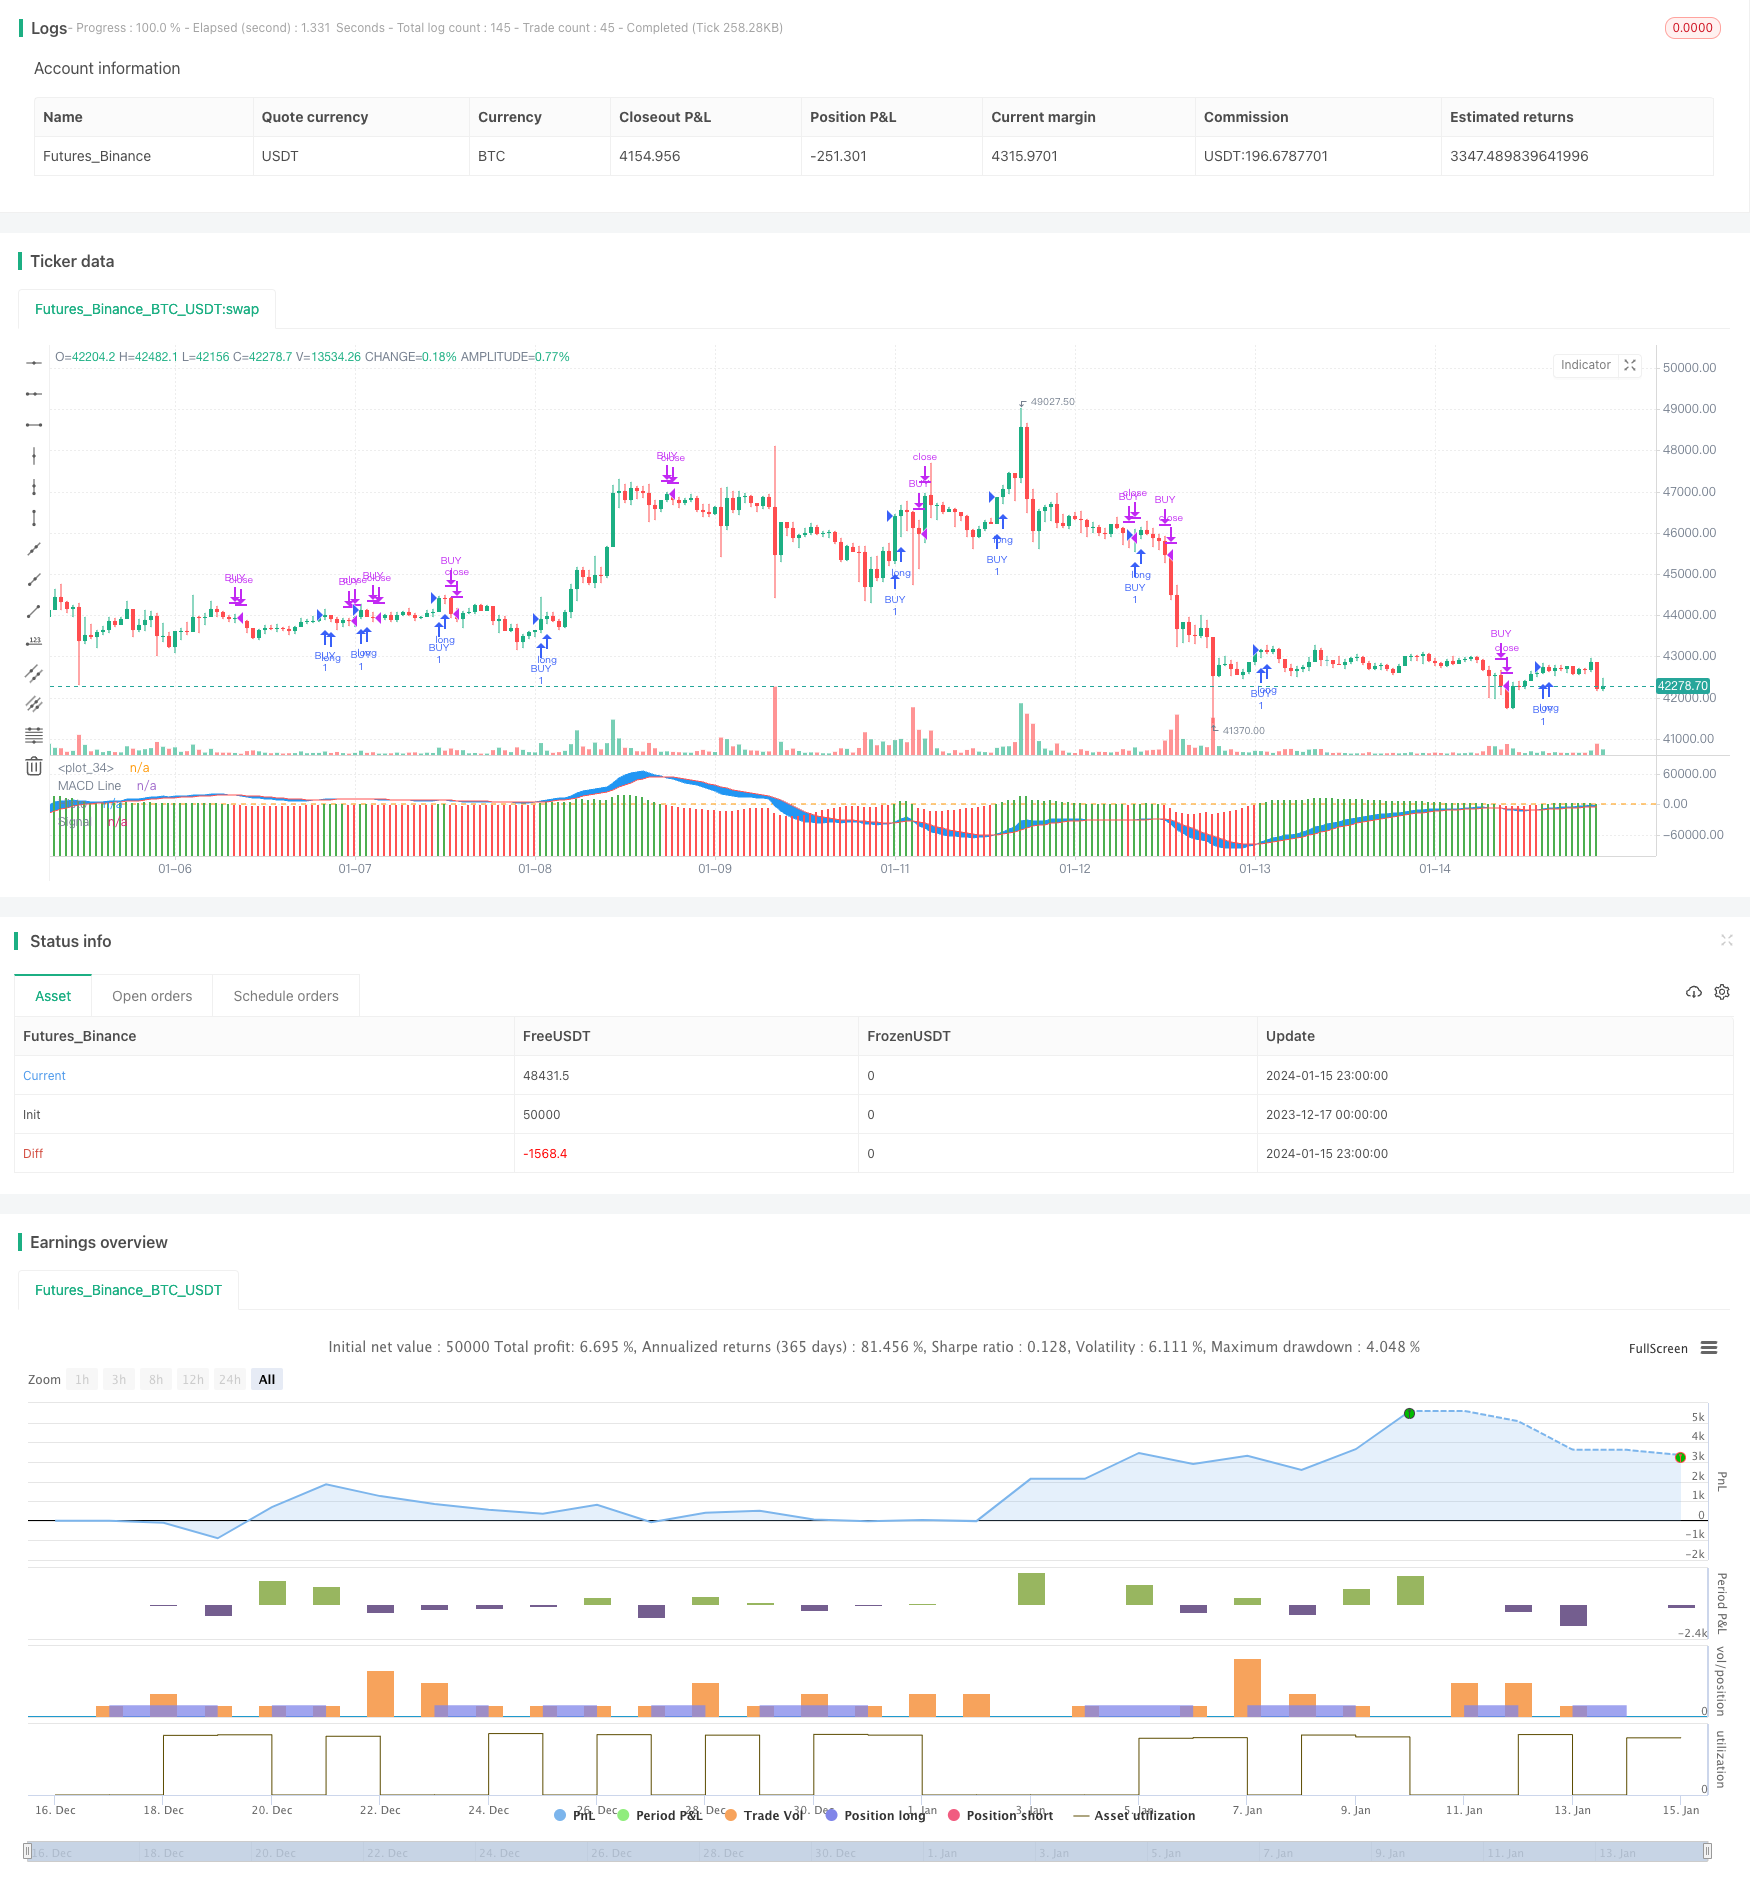
/*backtest
start: 2023-12-17 00:00:00
end: 2024-01-16 00:00:00
period: 1h
basePeriod: 15m
exchanges: [{"eid":"Futures_Binance","currency":"BTC_USDT"}]
*/

//@version=3

strategy(title = "MACD of OBV", overlay = false)

//////////////////////// OBV ///////////////////////////

src = close
obv = cum(change(src) > 0 ? volume : change(src) < 0 ? -volume : 0*volume)


//////////////////////// OBV   //////////////////////////

//////////////// MACD OF OBV ////////////////////////////

sourcemacd = obv

fastLength = input(12, minval=1), slowLength=input(26,minval=1)
signalLength=input(9,minval=1)


fastMA = ema(sourcemacd, fastLength)
slowMA = ema(sourcemacd, slowLength)

macd = fastMA - slowMA
signal = ema(macd, signalLength)
delta=macd-signal

swap1 = delta>0?green:red

plot(delta,color=swap1,style=columns,title='Histo',histbase=0,transp=20)
p1 = plot(macd,color=blue,title='MACD Line')
p2 = plot(signal,color=red,title='Signal')
fill(p1, p2, color=blue)
hline(0)


/////////////////////////MACD OF OBV //////////////////////////


// Conditions


longCond = na
sellCond = na
longCond :=  crossover(delta,0)
sellCond :=  crossunder(delta,0)


monthfrom =input(6)
monthuntil =input(12)
dayfrom=input(1)
dayuntil=input(31)


if (  longCond )
    strategy.entry("BUY", strategy.long, stop=close, oca_name="TREND",  comment="BUY")

else
    strategy.cancel(id="BUY")


if ( sellCond  )

    strategy.close("BUY")