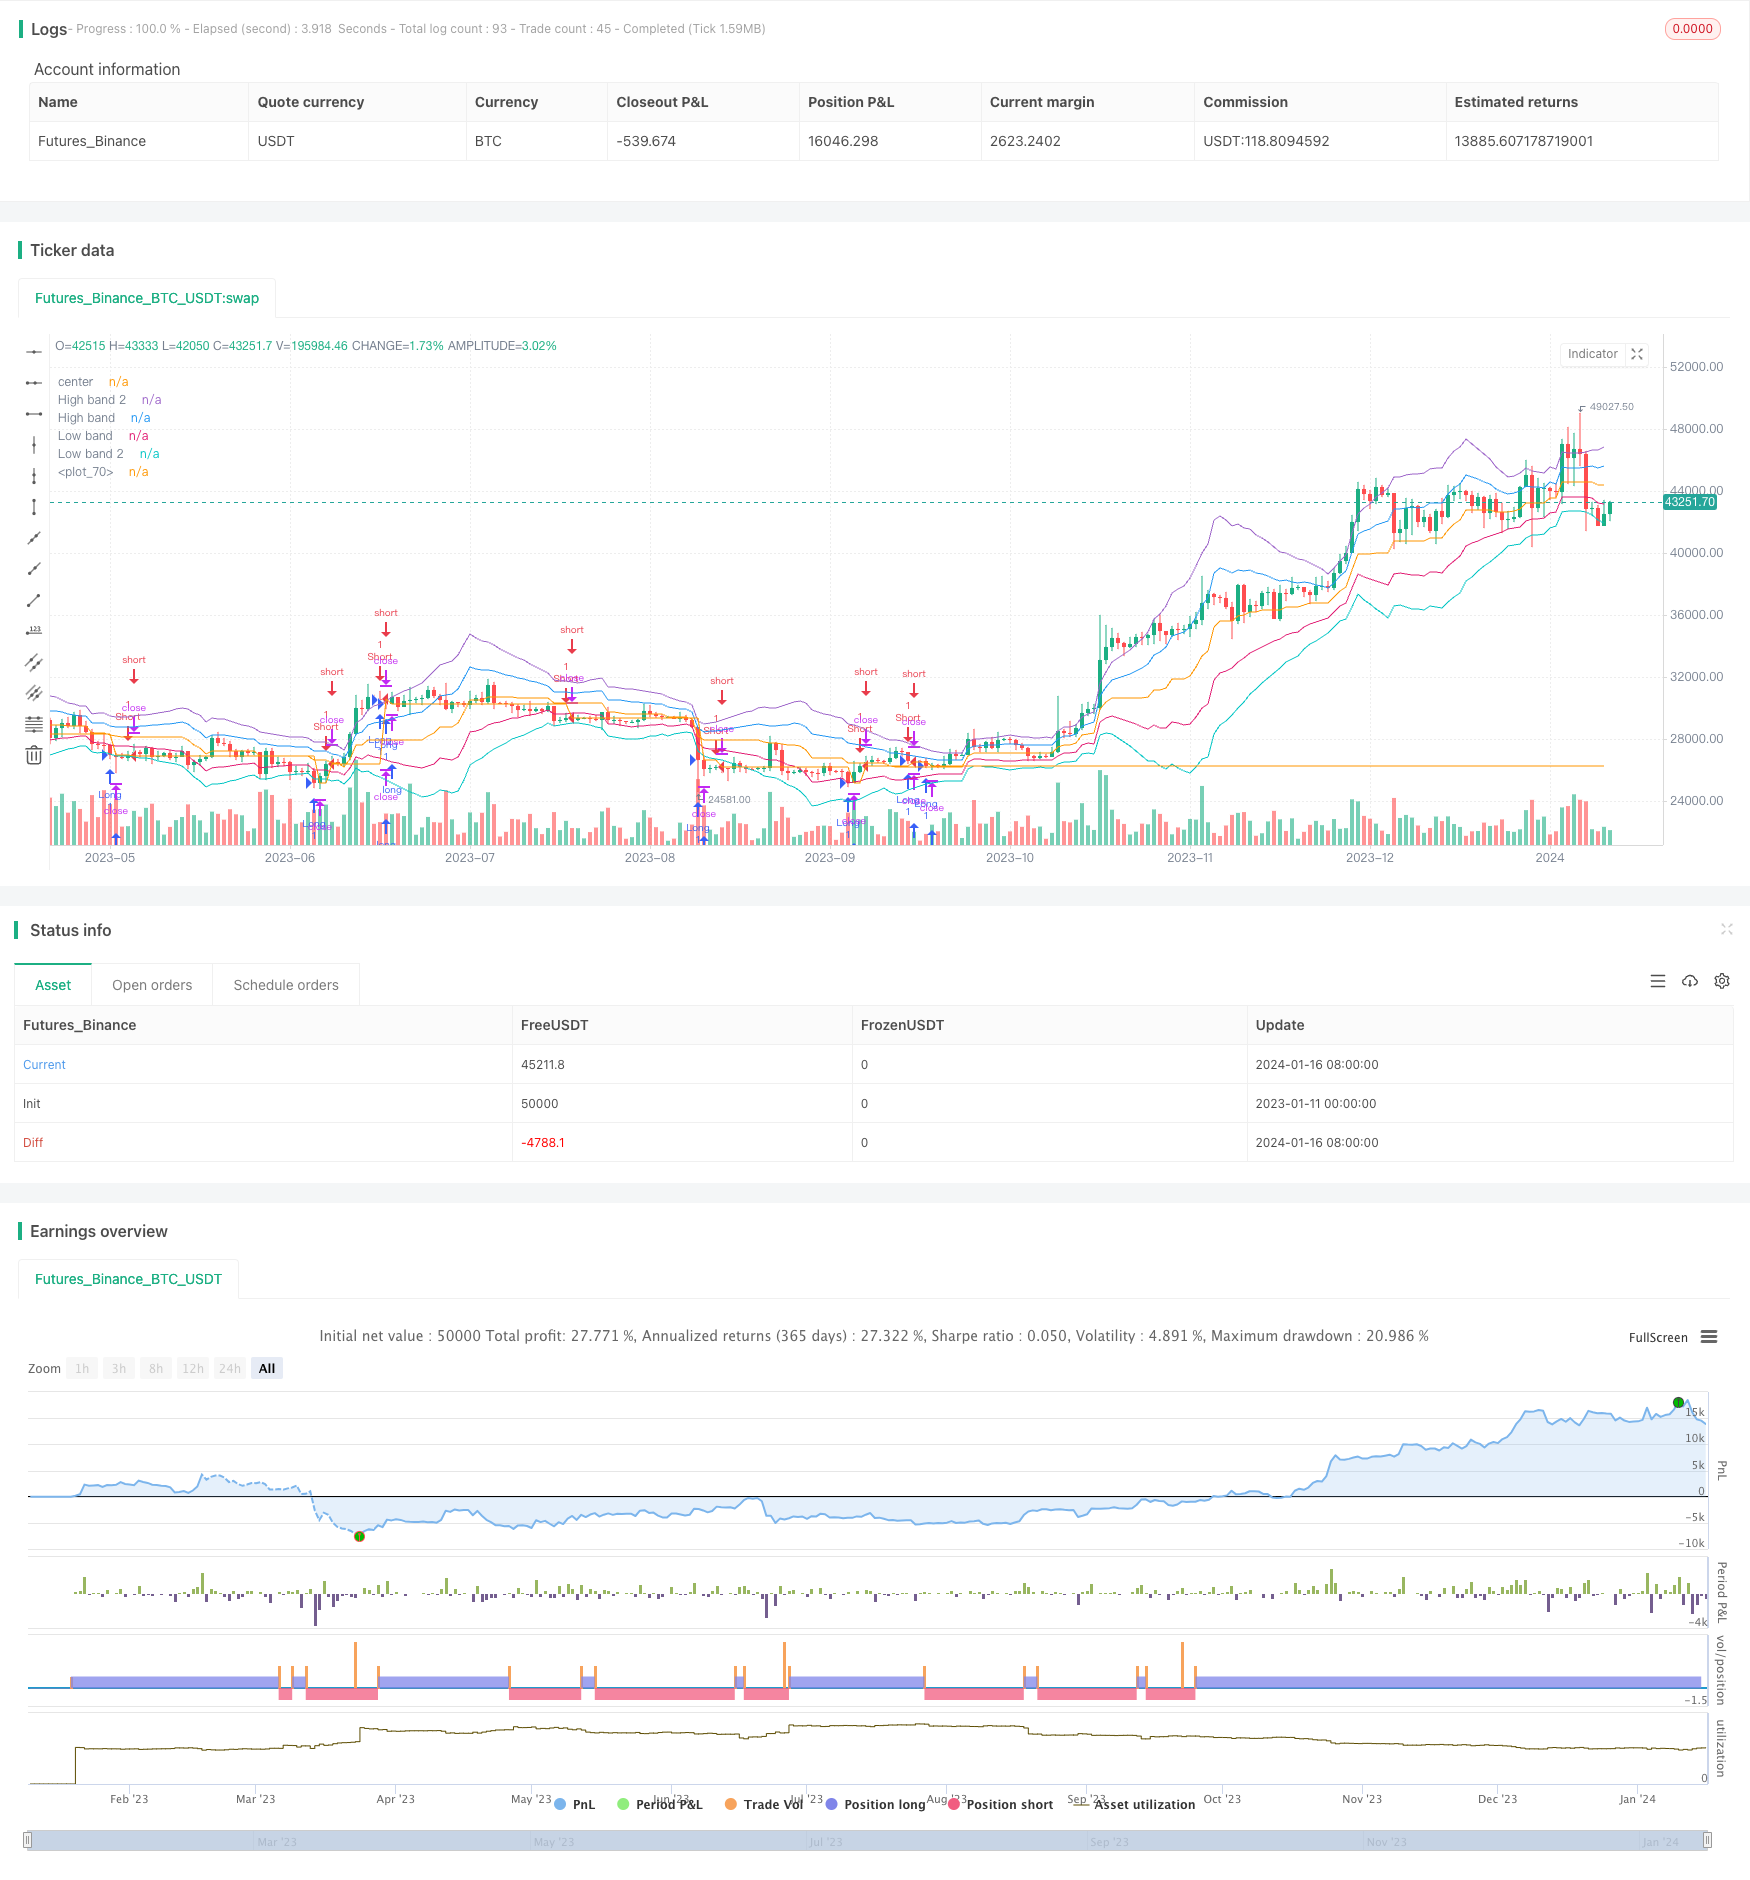
概述
该策略是一个基于Noro的波段理论与量化技术相结合的动量突破策略。它通过计算均线、RSI、波段以及牛熊色彩等多种指标,形成买卖信号并实现波段突破交易。
策略原理
- 通过平均真实波幅计算出波段的上下轨。价格突破上轨为看涨信号,突破下轨为看跌信号。
- 通过RSI指标判断超买超卖区域,RSI低于30看涨,高于70看跌。
- 通过最高价与最低价的突破来判断价格的动量方向。
- 通过牛熊色彩来判断多头与空头市场。绿色为多头市场,看涨;红色为空头市场,看跌。
- 结合均线判断背离来发出交易信号。
优势分析
- 多种指标组合,提高精确度。
- 波段理论与量化技术的结合,使策略更有效。
- 动量突破与反转交易结合,增强盈利空间。
- 可扩展性强,可根据市场调整参数。
风险分析
- 参数设置需要不断优化和测试。
- 多空切换时无法及时反应,可能出现亏损。
- 交易次数较多,易受交易费用和滑点的影响。
- 需适时调整波段参数以符合不同周期。
优化方向
- 多时间周期验证,寻找最佳参数组合。
- 增加止损策略,降低单笔亏损。
- 加大仓位管理,提高盈利效率。
- 结合深度学习进行参数自动优化。
总结
本策略综合运用多种典型的量化技术指标,通过动量指标与反转指标的结合实现高效盈利。同时运用平均真实波幅理论寻找合理的入场点位。可谓技术指标与理论结合的典范。通过参数优化和风险控制的不断完善,必将成为高效稳定的量化策略。
策略源码
/*backtest
start: 2023-01-11 00:00:00
end: 2024-01-17 00:00:00
period: 1d
basePeriod: 1h
exchanges: [{"eid":"Futures_Binance","currency":"BTC_USDT"}]
*/


//@version=2
strategy("Noro's Bands Strategy v1.5", shorttitle = "NoroBands str 1.5", overlay=true)

//Settings
needlong = input(true, defval = true, title = "Long")
needshort = input(true, defval = true, title = "Short")
len = input(20, defval = 20, minval = 2, maxval = 200, title = "Period")
color = input(true, defval = true, title = "Use ColorBar")
usecb = input(true, defval = true, title = "Use CryptoBottom")
usersi = input(true, defval = true, title = "Use RSI")
usemm = input(true, defval = true, title = "Use min/max")
usepyr = input(true, defval = true, title = "Use pyramiding")
needbb = input(false, defval = false, title = "Show Bands")
needbg = input(false, defval = false, title = "Show Background")
needlo = input(false, defval = false, title = "Show Locomotive")
needpy = input(false, defval = false, title = "Show Avg.price line")
src = close

//Fast RSI
fastup = rma(max(change(src), 0), 2)
fastdown = rma(-min(change(src), 0), 2)
fastrsi = fastdown == 0 ? 100 : fastup == 0 ? 0 : 100 - (100 / (1 + fastup / fastdown))

//CryptoBottom
mac = sma(close, 10)
lencb = abs(close - mac)
sma = sma(lencb, 100)
max = max(open, close)
min = min(open, close)

//PriceChannel
lasthigh = highest(src, len)
lastlow = lowest(src, len)
center = (lasthigh + lastlow) / 2

//dist
dist = abs(src - center)
distsma = sma(dist, len)
hd = center + distsma
ld = center - distsma
hd2 = center + distsma * 2
ld2 = center - distsma * 2

//Trend
trend = close < ld and high < hd ? -1 : close > hd and low > ld ? 1 : trend[1]

//Lines
colo = needbb == false ? na : black
plot(hd2, color = colo, linewidth = 1, transp = 0, title = "High band 2")
plot(hd, color = colo, linewidth = 1, transp = 0, title = "High band")
plot(center, color = colo, linewidth = 1, transp = 0, title = "center")
plot(ld, color = colo, linewidth = 1, transp = 0, title = "Low band")
plot(ld2, color = colo, linewidth = 1, transp = 0, title = "Low band 2")

//Background
col = needbg == false ? na : trend == 1 ? lime : red
bgcolor(col, transp = 80)

//Signals
up = trend == 1 and ((close < open or color == false) or close < hd) and (min < min[1] or usemm == false) and (close < strategy.position_avg_price or usepyr == false or strategy.position_size <= 0) ? 1 : 0
dn = trend == -1 and ((close > open or color == false) or close > ld) and (max > max[1] or usemm == false) and (close > strategy.position_avg_price or usepyr == false or strategy.position_size >= 0) ? 1 : 0
up2 = close < open and lencb > sma * 3 and min < min[1] and fastrsi < 10 and (close < strategy.position_avg_price or usepyr == false or strategy.position_size <= 0) ? 1 : 0 //CryptoBottom
//dn2 = close > open and len > sma * 3 and max > max[1] and fastrsi > 90 ? 1 : 0 //CryptoBottom
up3 = fastrsi < 5 and usersi == true and (close < strategy.position_avg_price or usepyr == false or strategy.position_size <= 0) ? 1 : 0
//dn3 = fastrsi > 95 and usersi = true ? 1 : 0

//Avg Price
colpy = needpy == false ? na : black
plot(strategy.position_avg_price, color = colpy)

up4 = close < strategy.position_avg_price and usepyr == true and strategy.position_size >= 0 ? 1 : 0
dn4 = close > strategy.position_avg_price and usepyr == true and strategy.position_size <= 0 ? 1 : 0

//Locomotive
uploco = trend == 1 and close < open and min < min[1] and close < center ? 1 : 0
plotarrow(needlo == true and uploco == 1 ? 1 : 0, colorup = black, colordown = black, transp = 0)

longCondition = up == 1 or (up2 == 1 and usecb == true) or (up3 == 1 and usersi == true) or up4 == 1
if (longCondition)
    strategy.entry("Long", strategy.long, needlong == false ? 0 : na)

shortCondition = dn == 1 or dn4 == 1
if (shortCondition)
    strategy.entry("Short", strategy.short, needshort == false ? 0 : na)