概述
该策略利用50周期的EMA均线和K线的收盘价进行判断,在价格向下突破EMA均线时做空,等待价格回调2-3根K线后,如果出现吞噬形态的K线,则在该K线收盘后开仓做空,进行短线操作。
策略原理
首先计算50周期的EMA均线,然后判断价格是否从上向下突破该EMA均线,如果突破则记录为空头冲动。然后判断后续K线是否出现向上的回调,如果回调幅度超过上一根K线的最低价,则记为回调信号。在回调后,进一步判断后续1-2根K线是否形成吞噬形态,如果形成吞噬则记录为吞噬信号。当同时满足空头冲动、回调和吞噬3个条件时,在该吞噬K线收盘后开仓做空,进行短线操作。
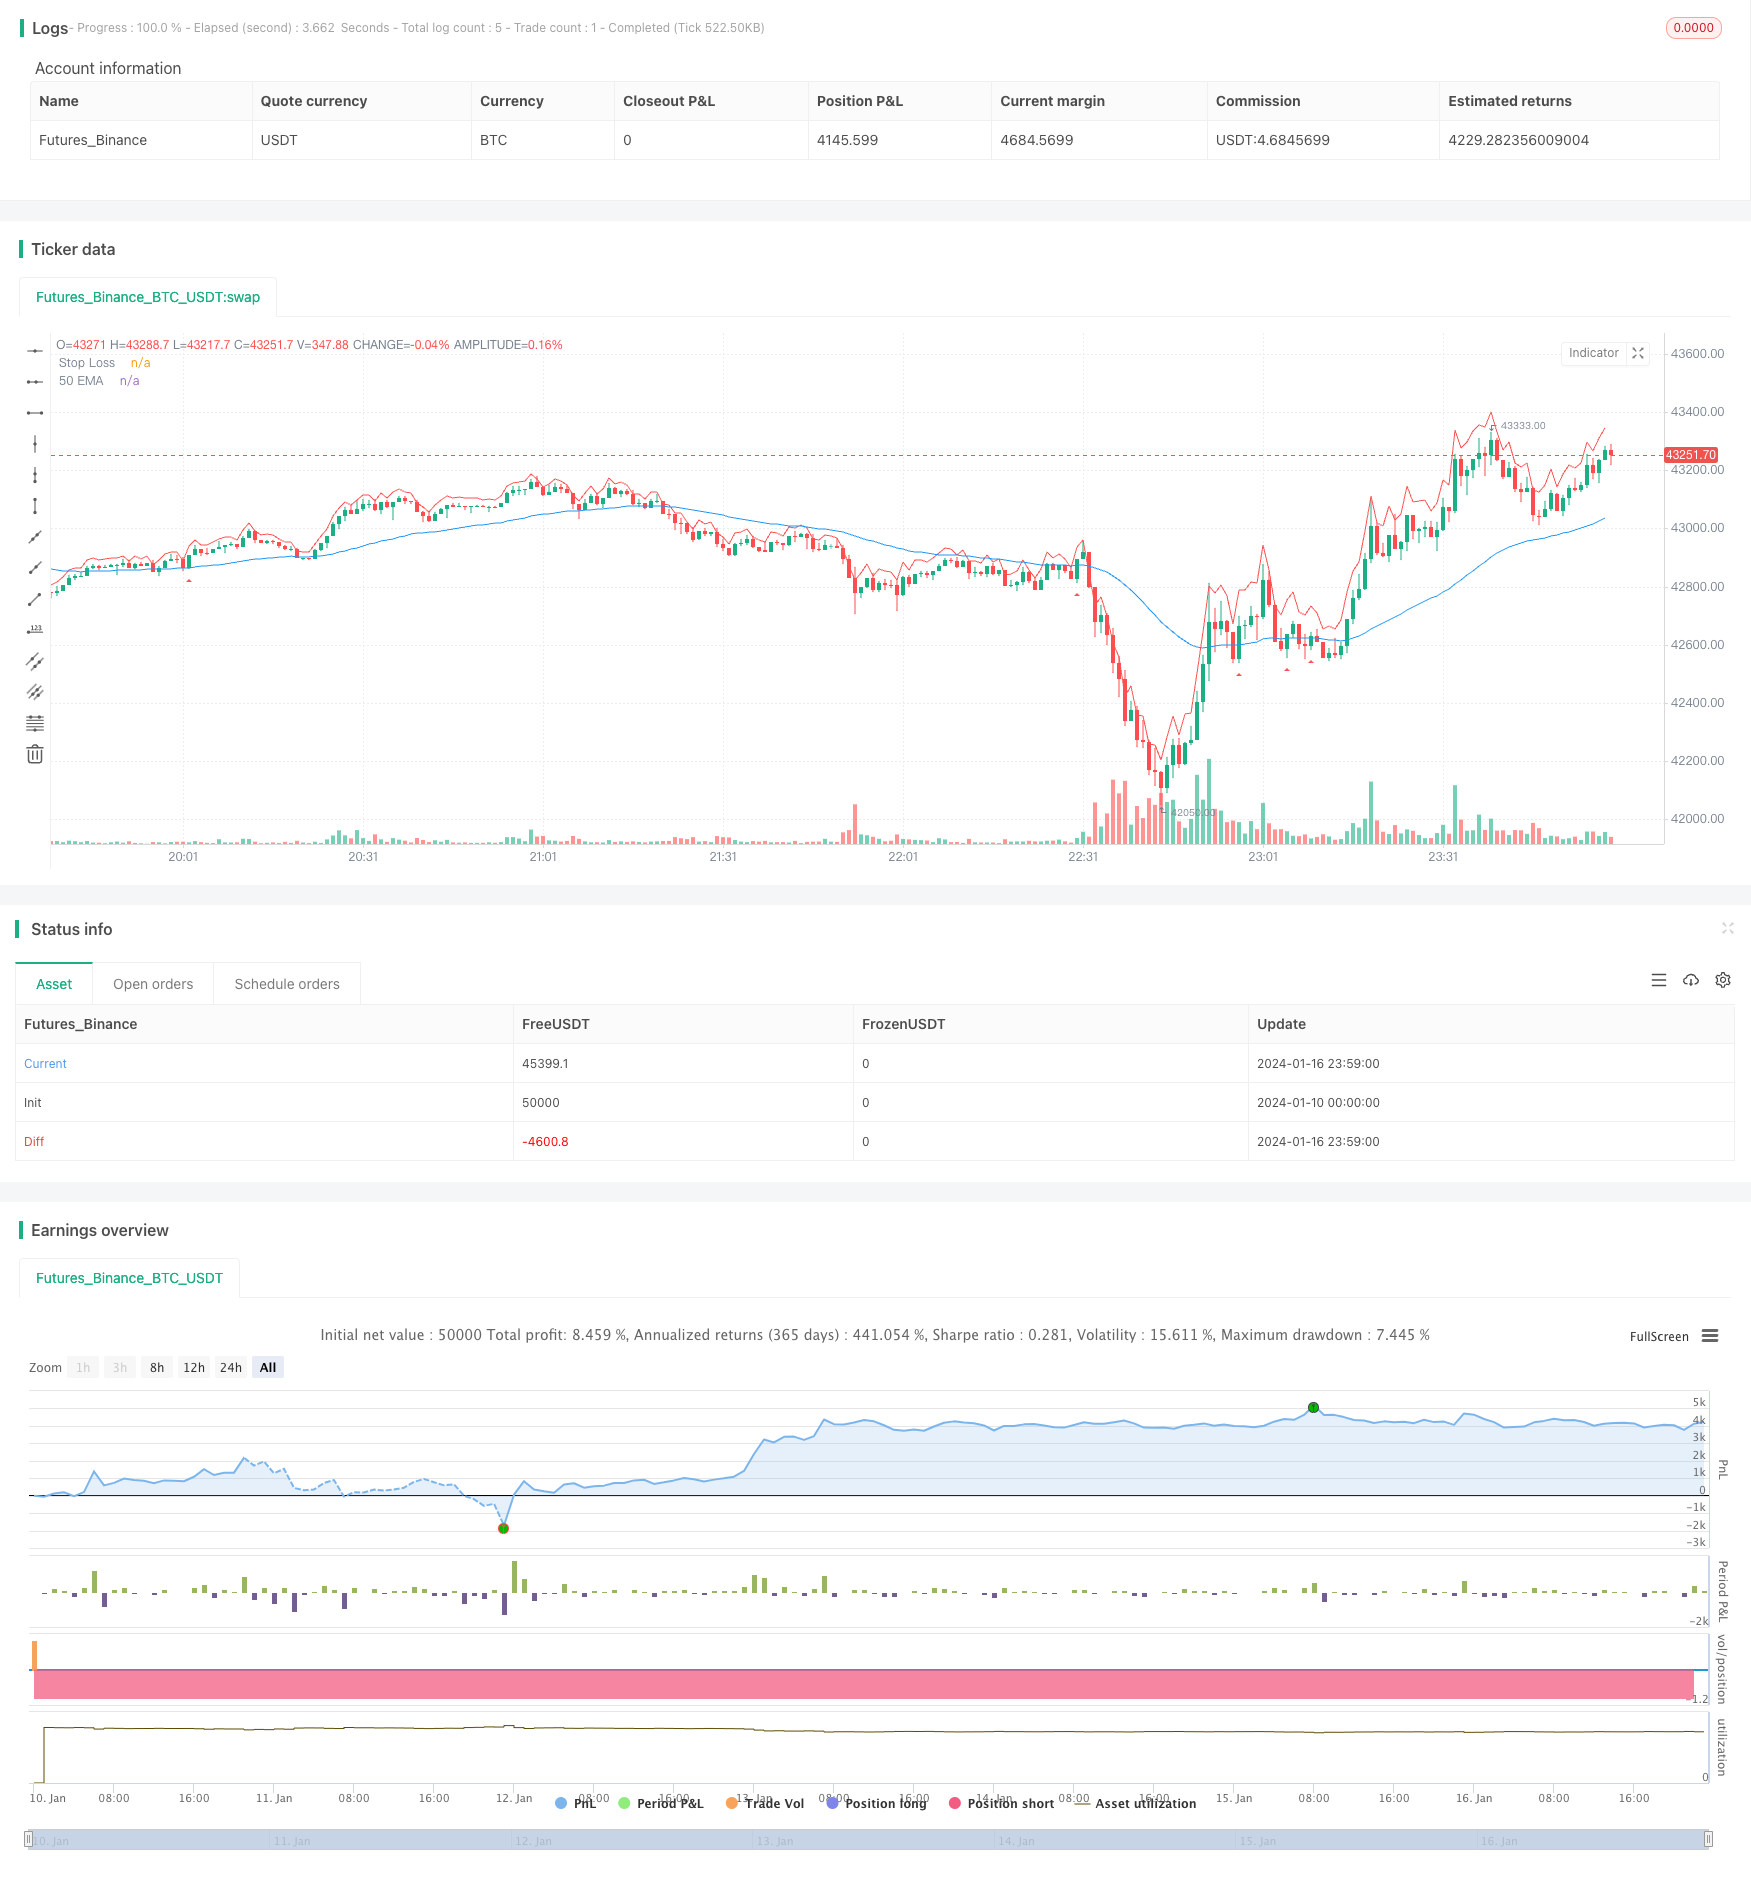
策略会绘制50周期EMA均线,在发出做空信号时,在K线下方绘制向下红色三角标记。同时给出止损位,绘制红色的止损线。
优势分析
该策略結合趋势判断和形态特征,能够有效抓住趋势反转机会。首先利用EMA判别趋势方向,然后在回调过程中利用吞噬形态发出信号,避免被假突破所迷惑。止损清晰,回撤控制到位。适合短线操作。
风险分析
该策略主要依赖EMA判定趋势方向,如果出现剧烈的突破可能会产生误判。吞噬形态判断有一定主观性,数量和深度都需要参数优化。止损位置也需要根据市场波动程度进行调整。总体来说,该策略更适合稳定运行的股指市场,适合短线操作。
可以通过优化EMA参数、回调K线数量、吞噬K线数量等参数来获得更好的策略效果。此外,还可以考虑结合其他指标判断趋势和回调信号。
优化方向
EMA周期优化:可以测试更多的EMA周期,如30、40或60周期,找到最佳参数。
回调K线数量优化:测试2-5根等不同数量,找到最佳回调信号。
吞噬K线数量优化:测试1-3根等不同数量,找到最佳吞噬信号。
止损倍数优化:可以测试0.5-2倍ATR止损,找到最佳止损位置。
考虑加入其他指标判定信号,如MACD、KDJ等,提高信号准确性。
可以测试不同的品种,如股指、原油、贵金属等,扩大适用范围。
总结
该策略首先利用EMA判断趋势方向,然后结合回调和吞噬形态发出做空信号,是一种典型的趋势反转策略。它结合趋势判断和形态特征,能够有效抓住反转机会。策略参数优化到位后,可以获得不错的效果。总体来说,该策略操作简单,风险可控,非常适合短线操作。它的优点在于及时抓住反转行情,而且有明确的止损点。总体来说,该策略具有一定的实用价值。
/*backtest
start: 2024-01-10 00:00:00
end: 2024-01-17 00:00:00
period: 1m
basePeriod: 1m
exchanges: [{"eid":"Futures_Binance","currency":"BTC_USDT"}]
*/

//@version=4
strategy(title="Linor Pullback Short Strategy", shorttitle="EMA Pullback", overlay=true)

// Define strategy parameters
ema_length = input(50, title="EMA Length")
pullback_candles = input(3, title="Number of Pullback Candles")
engulfing_candles = input(1, title="Number of Engulfing Candles")
stop_loss = input(1, title="Stop Loss (in ATR)")

// Calculate the EMA
ema = ema(close, ema_length)

// Define bearish impulse condition
bearish_impulse = crossover(close, ema)

// Define pullback condition
pullback_condition = false
for i = 1 to pullback_candles
    if close[i] > close[i - 1]
        pullback_condition := true
    else
        pullback_condition := false

// Define engulfing condition
engulfing_condition = false
for i = 1 to engulfing_candles
    if close[i] < open[i] and close[i-1] > open[i-1]
        engulfing_condition := true
    else
        engulfing_condition := false

// Define the entry condition
entry_condition = bearish_impulse and pullback_condition and engulfing_condition

// Plot the EMA on the chart
plot(ema, color=color.blue, title="50 EMA")

// Plot shapes on the chart to mark entry points
plotshape(entry_condition, style=shape.triangleup, location=location.belowbar, color=color.red, size=size.small)

// Define and plot the stop loss level
atr_value = atr(14)
stop_loss_level = close + atr_value * stop_loss
plot(stop_loss_level, color=color.red, title="Stop Loss")

// Strategy orders
strategy.entry("Short", strategy.short, when=entry_condition)
strategy.exit("Stop Loss/Target", from_entry="Short", stop=stop_loss_level, when=strategy.position_size[1] > 0)

// Plot strategy performance on the chart