1. 概述
这是一个结合RSI指标和 Bollinger 布林带的低位区间突破策略。它的主要思想是在RSI低于10时买入,在RSI高于90时卖出,并以5周期SMA为止损线。
2. 原理
当RSI指标低于10时视为超买信号,此时股票被高估的可能性很小,是比较好的买入时机。当RSI指标高于90时视为超卖信号,视为一个卖出信号。 止损线设定为5周期简单移动平均线,是为了防止由于行情短期内的正常波动而止损。
3. 优势
这是一个利用指标信号进行低买高卖的统计套利策略。它最大的优势在于,通过RSI指标判断买卖点,可以有效抓住股票被高估低估的时机,实现超额盈利。同时,结合布林带进行区间突破判断,可以避免兜底和追涨杀跌的风险。
4. 风险及解决
这种策略最大的风险在于,行情短期内的正常波动可能超过止损线从而造成无谓的止损。此外,如果没有及时止盈,也可能错失利润。 解决方法是,适当调整止损线的周期参数,防止正常波动就被止损。同时,也可以设置止盈线,在达到目标收益后主动止盈。
5. 优化方向
这种策略可以通过以下几个方面进行优化:
(1)调整RSI指标的超买超卖临界值,如调整为15和85,获得更多交易机会。
(2)优化止损线的周期参数,使其适应市场的短期波动。
(3)增加止盈线设置,能自动止盈和风险控制。
(4)结合波动率指标优化参数,如加入ATR指标等。
6. 总结
RSI+Bollinger双轨低位区间突破策略,通过RSI指标判断买卖点,布林带判断区间,SMA作为止损线,能有效抓住行情,控制风险,实现稳定盈利。这种策略优化空间还很大,值得进一步研究。
策略源码
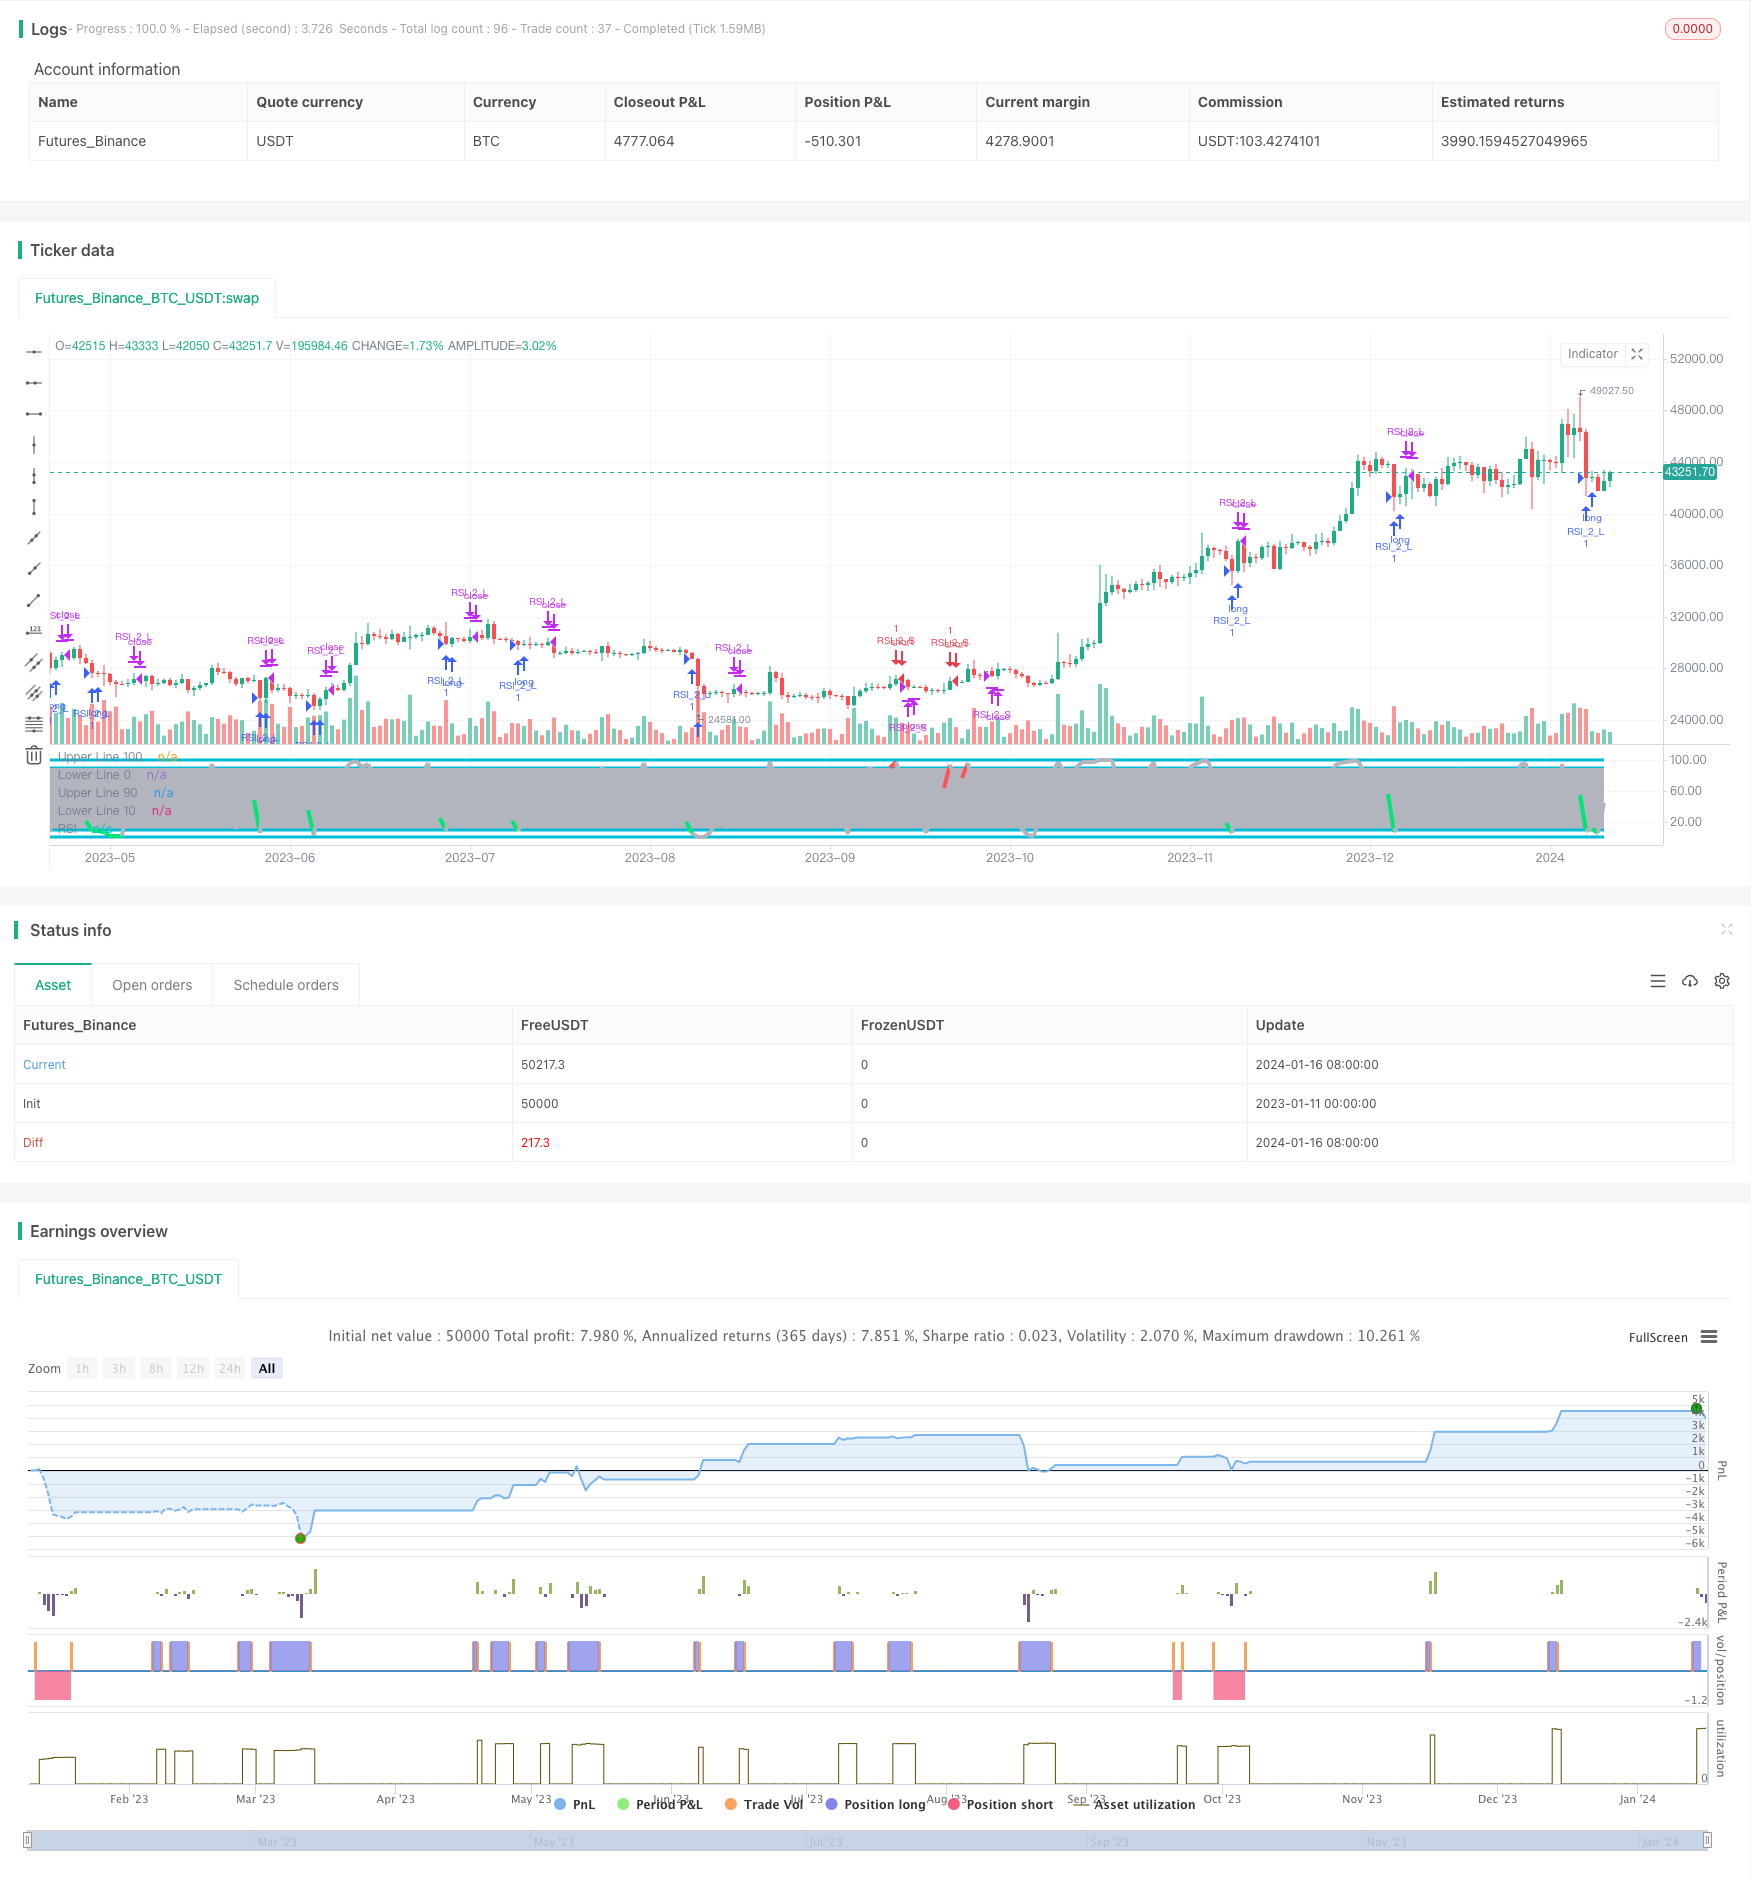
/*backtest
start: 2023-01-11 00:00:00
end: 2024-01-17 00:00:00
period: 1d
basePeriod: 1h
exchanges: [{"eid":"Futures_Binance","currency":"BTC_USDT"}]
*/

//@version=2
//Created by ChrisMoody
//Based on Larry Connors RSI-2 Strategy - Lower RSI
strategy(title="_CM_RSI_2_Strat_Low", shorttitle="_CM_RSI_2_Strategy_Lower", overlay=false)
src = close,

//RSI CODE
up = rma(max(change(src), 0), 2)
down = rma(-min(change(src), 0), 2)
rsi = down == 0 ? 100 : up == 0 ? 0 : 100 - (100 / (1 + up / down))
//Criteria for Moving Avg rules
ma1 = sma(close,1)
ma2 = sma(close,2)
ma3 = sma(close,3)
ma4 = sma(close,4)
ma5 = sma(close,5)
ma6 = sma(close,6)
ma7 = sma(close,7)
ma8 = sma(close,8)
ma9 = sma(close,9)
ma200= sma(close, 200)

//Rule for RSI Color
col = close > ma200 and close < ma5 and rsi < 10 ? lime : close < ma200 and close > ma5 and rsi > 90 ? red : silver

plot(rsi, title="RSI", style=line, linewidth=4,color=col)
plot(100, title="Upper Line 100",style=line, linewidth=3, color=aqua)
plot(0, title="Lower Line 0",style=line, linewidth=3, color=aqua)

band1 = plot(90, title="Upper Line 90",style=line, linewidth=3, color=aqua)
band0 = plot(10, title="Lower Line 10",style=line, linewidth=3, color=aqua)
fill(band1, band0, color=silver, transp=90)

///////////// RSI + Bollinger Bands Strategy


if (close > ma200 and rsi < 10)
    strategy.entry("RSI_2_L", strategy.long, comment="Bullish")
if (close < ma200 and rsi > 90)
    strategy.entry("RSI_2_S", strategy.short, comment="Bearish")


strategy.close("RSI_2_L", when = close > ma5)
strategy.close("RSI_2_S", when = close < ma5)