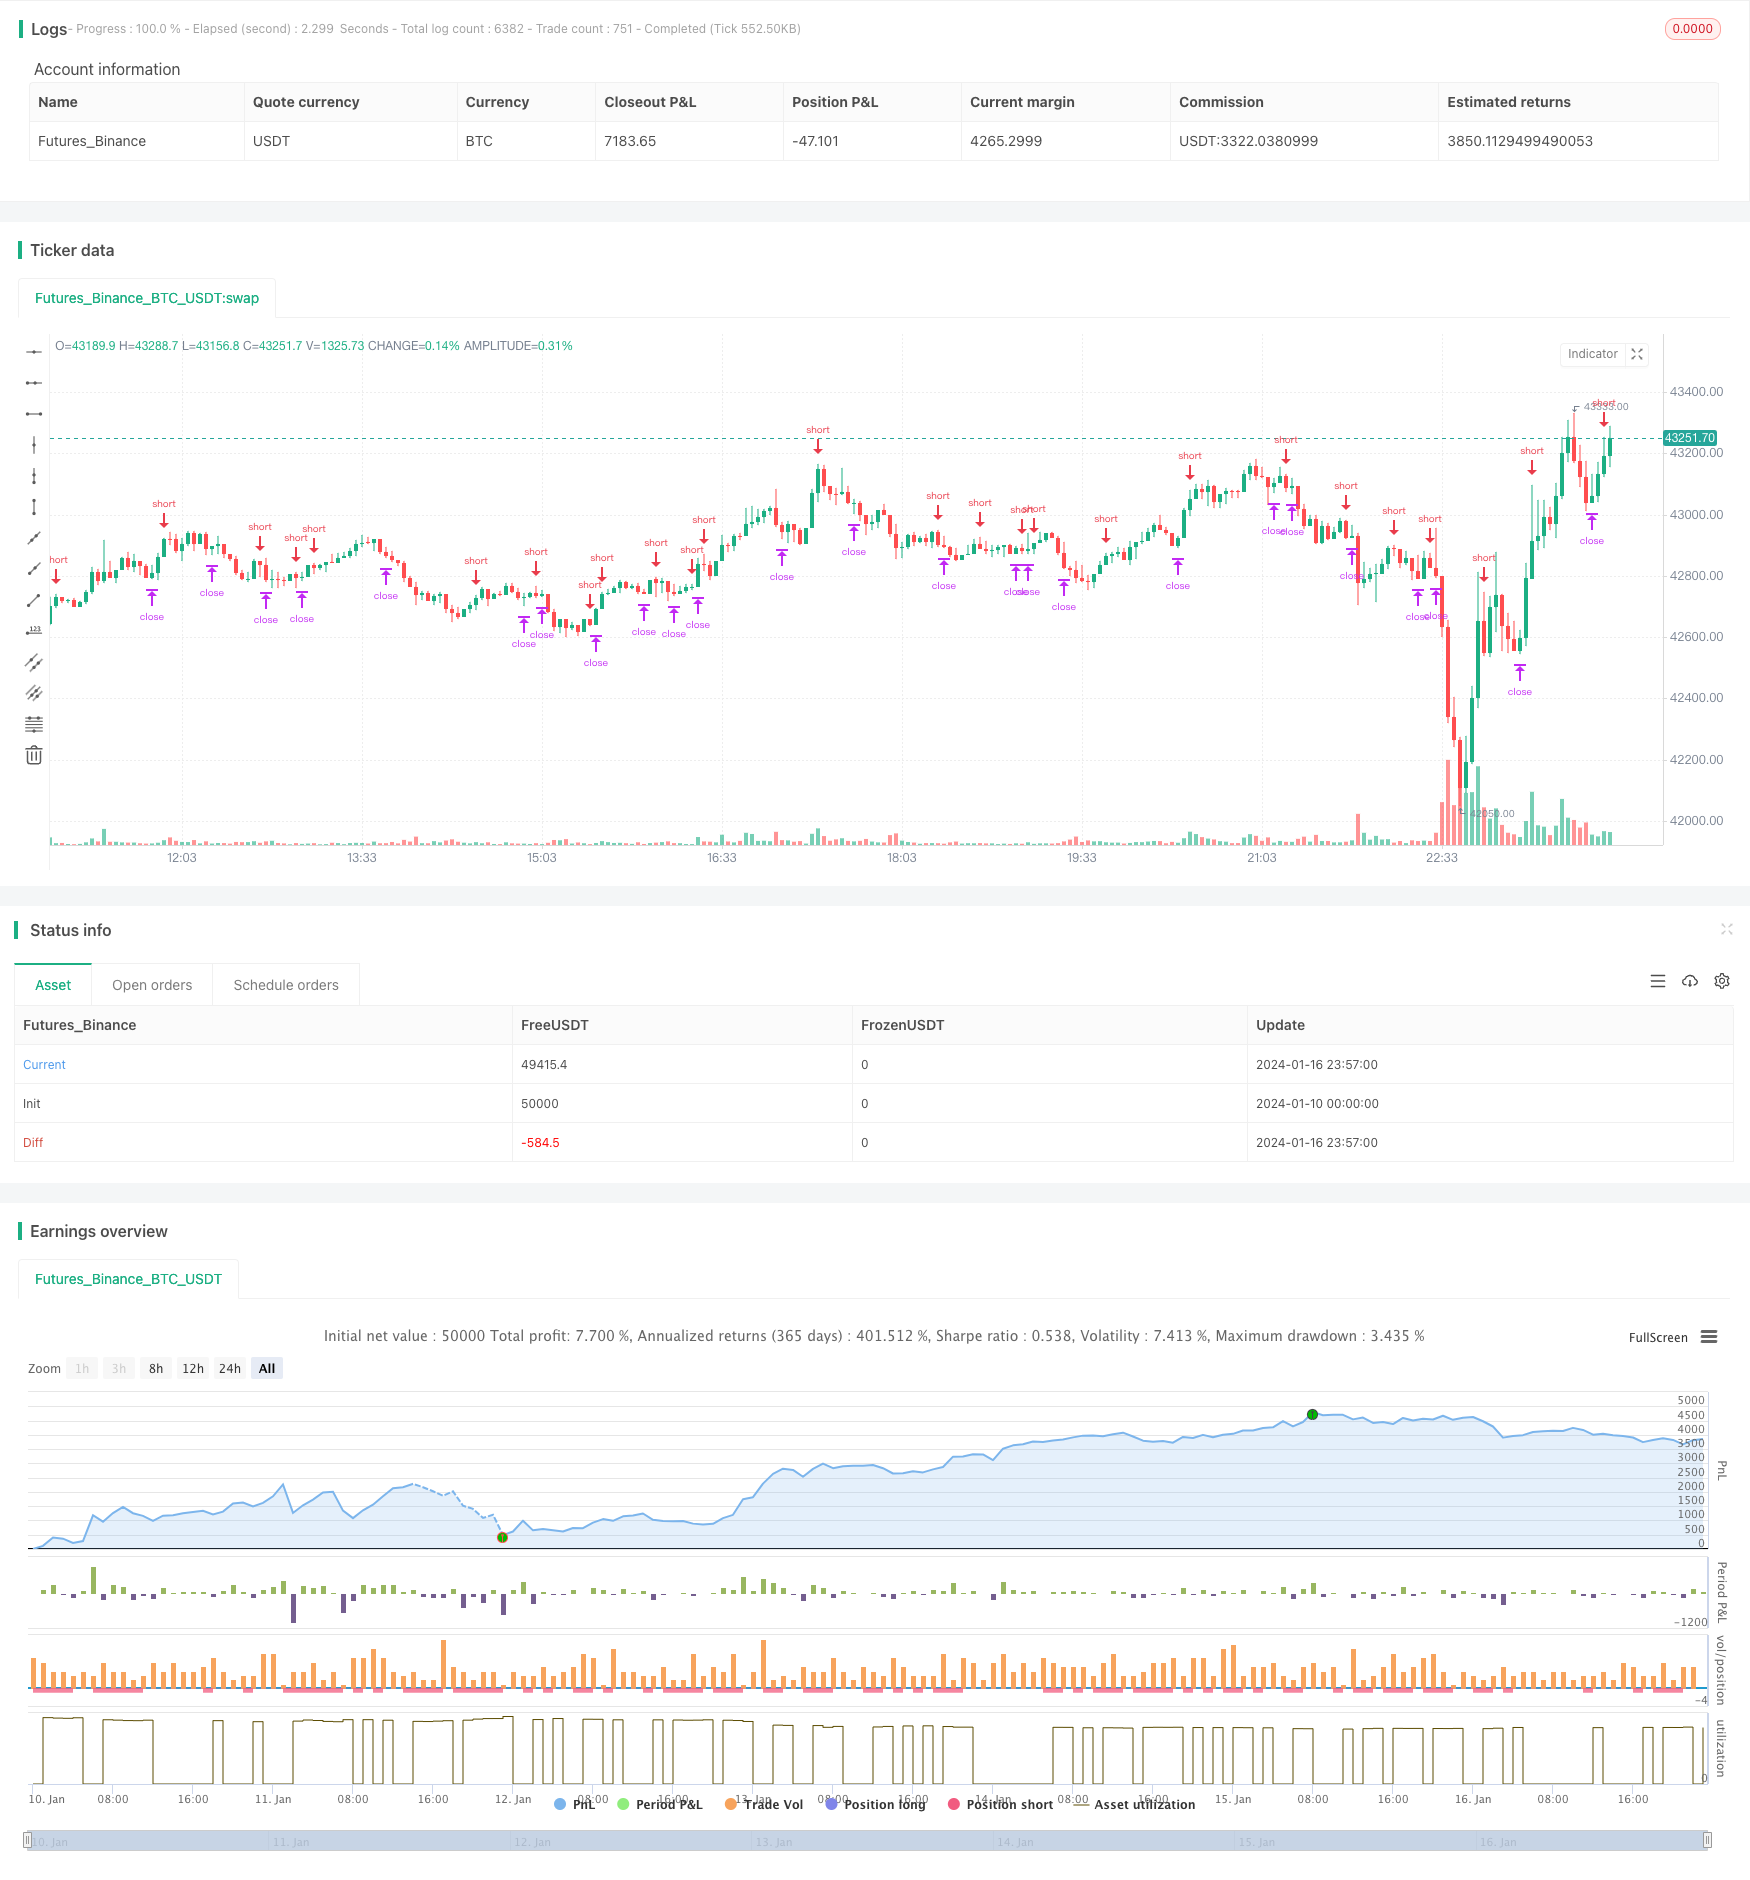
概述
该策略基于比特币的周线收盘价和8周简单移动平均线进行交易。当周线收盘价上穿8周线时,做多;当周线收盘价下穿8周线时,平仓。同时设置了止损止盈比例,以控制风险。
策略原理
该策略通过分析比特币的周线行情及8周简单移动平均线,判断市场目前是处于上涨趋势还是下跌趋势。当周线收盘价突破向上突破8周线时,表示市场步入上涨通道,做多能获利;当周线收盘价下方穿越8周线时,表示比特币周线进入下跌通道,应当止损了结此前的多单。
具体来说,策略里设置了以下判断条件:
buy_condition= crossover(btc,ma)#周线收盘价上穿8周线,做多
sell_condition= crossunder(btc,ma)#周线收盘价下穿8周线,平仓
当买入条件成立时,策略会进入做多;当平仓条件成立时,策略会选择止盈或止损出场。
此外,策略还设置了止损止盈的比例:
loss_ratio=input(defval=1,title="LOSS RATIO", group="STRATEGY")
reward_ratio=input(defval=3,title="REWARD RATIO", group="STRATEGY")
其中,止损比例默认为1,止盈比例默认为3。这意味着当平仓信号来时,如果当前盈利,则会以盈利的3倍来止盈;如果当前亏损,则会以亏损的1倍来止损。
优势分析
该策略具有以下优势:
- 周线操作,回撤小,适合长线持有
- 8周线过滤震荡,识别主要趋势
- 设置止损止盈,控制风险
风险分析
该策略也存在一些风险:
- 周线操作,无法针对短期行情调整仓位
- 突破信号可能出现错误信号
- 市场异常时,止损止盈设置可能失效
对策: 1. 可结合其他短周期指标,识别短期调整的机会 2. 增加过滤条件,避免错误信号 3. 根据市场情况调整止损止盈比例,降低亏损
优化方向
该策略可以从以下几个方面进行优化:
- 增加其他过滤条件,确保突破信号的有效性
- 优化止损止盈比例的设置
- 结合短周期指标,实现多时间框架的配合
- 利用机器学习算法自动优化参数
总结
该策略整体来说比较简单直接,通过周线突破平均线来判断行情趋势;同时设置了止损止盈来控制风险。可作为长线持有比特币的参考。但该策略也存在一定盲区,后续可从提高信号有效性、优化参数设置、实现多时间框架结合等方面进行改进。
策略源码
/*backtest
start: 2024-01-10 00:00:00
end: 2024-01-17 00:00:00
period: 3m
basePeriod: 1m
exchanges: [{"eid":"Futures_Binance","currency":"BTC_USDT"}]
*/

// This source code is subject to the terms of the Mozilla Public License 2.0 at https://mozilla.org/MPL/2.0/
// © taberandwords
//developer: taberandwords
//author: taberandwords
//@version=4

strategy("WEEKLY BTC TRADING SCRYPT","WBTS",overlay=false,default_qty_type=strategy.fixed)

source=input(defval=close,title="source",group="STRATEGY")

btc=security('BTCUSDT','1W', source)
ma=sma(btc,8)

buy_condition= crossover(btc,ma)
sell_condition= crossunder(btc,ma)

ma_color=input(defval=#FF3232,title="COLOR",group="MA")
ma_linewidth=input(defval=2,title="LINE WIDTH",group="MA")
graphic_color=input(defval=#6666FF,title="COLOR",group="GRAPHIC")
graphic_linewidth=input(defval=2,title="LINE WIDTH",group="GRAPHIC")

start_date=input(defval=2020,title="YEAR",group="STRATEGY EXECUTION YEAR")

loss_ratio=input(defval=1,title="LOSS RATIO", group="STRATEGY")
reward_ratio=input(defval=3,title="REWARD RATIO", group="STRATEGY")

if(year>=start_date)
    strategy.entry('BUY',long=true,when=buy_condition,alert_message='Price came to buying value!')

    if(strategy.long)
        alert('BTC buy order trigerred!',alert.freq_once_per_bar)
    strategy.exit(id="SELL",loss=loss_ratio,profit=reward_ratio,when=sell_condition,alert_message='Price came to position closing value!')
    if(sell_condition)
        alert('BTC sell order trigerred!',alert.freq_once_per_bar)
plot(series=source,title="WEEKLY CLOSE",color=graphic_color,linewidth=graphic_linewidth)
plot(ma,title="SMA8 WEEKLY",color=ma_color,linewidth=ma_linewidth)
plot(strategy.equity,display=0)