概述
该策略是一个适用于比特币和以太坊的简单移动平均线趋势跟随策略。它结合了均线、MACD 和 RSI 等多个指标来识别趋势方向,采用固定仓位长线持仓的方式跟踪趋势。
策略原理
策略的核心逻辑是当20日EMA线上穿100日SMA线且100日SMA线上穿200日SMA线时做多;当20日EMA线下穿100日SMA线时平仓。即利用三条不同期限的移动平均线确定趋势方向。
具体来说,策略通过计算20日EMA线、100日SMA线和200日SMA线的值,并比较它们的大小关系来判断趋势。当20日EMA线上穿100日SMA线,即20日EMA线大于100日SMA线,说明价格开始上涨;此时如果100日SMA线也大于200日SMA线,说明中长期趋势也在上升,这是一个较强的做多信号。
在进入做多仓位后,策略会一直持有仓位,跟随趋势运行。当20日EMA线重新下穿100日SMA线时,说明短期趋势出现反转信号,这时策略会选择平仓止损。
此外,策略还结合MACD和RSI等指标来确认趋势。只有当MACD的DIF线、DEMA线和HIST柱形线都是上涨的,同时RSI指标高于50时,才会选择开仓做多。
策略优势
该策略最大的优势在于制定清晰的趋势交易规则,能够有效跟踪中长线趋势。具体优势如下:
- 使用多组移动平均线结合判断趋势,比较可靠。
- 采用长线持仓的方式跟踪趋势运行,不容易被短期市场波动干扰。
- 结合MACD和RSI等指标进行策略信号确认,可以过滤假突破。
- 通过EMA线与SMA线的金叉与死叉来判断入场与出场点位,规则简单清晰。
- 能够有效控制风险,通过止损来限制亏损。
风险及解决
该策略也存在一些风险,主要问题在于当趋势反转时无法及时止损。具体风险及解决方法如下:
无法及时跟踪到趋势反转点:可以缩短均线周期,或者加入更多指标进行综合判断。
持仓时间过长容易产生较大亏损:可以适当缩短出场线,及时止损。
均线指标容易产生滞后:可以添加一定回撤比例的止损线,主动止损。
优化方向
该策略还可以从以下几个方面进行优化:
测试更多组合的均线周期,寻找最优参数。
尝试其他指标或模型来判断趋势和入场时机。例如布林带、KD指标等。
采用机器学习等方式动态优化参数。例如使用强化学习调整止损幅度。
结合交易量指标来避免假突破。例如能量潮指标、成交量等。
开发自动止损和追踪止损系统,能够根据市场情况调整止损位置。
总结
该策略整体是一个简单直接的趋势跟随策略。它利用移动平均线判断趋势方向,MACD和RSI过滤信号。采用较长的持仓时间跟踪趋势。能有效地把握中长线趋势机会。同时也存在滞后识别趋势反转的风险。未来可以通过参数优化、增加指标等方式进行改进与升级。
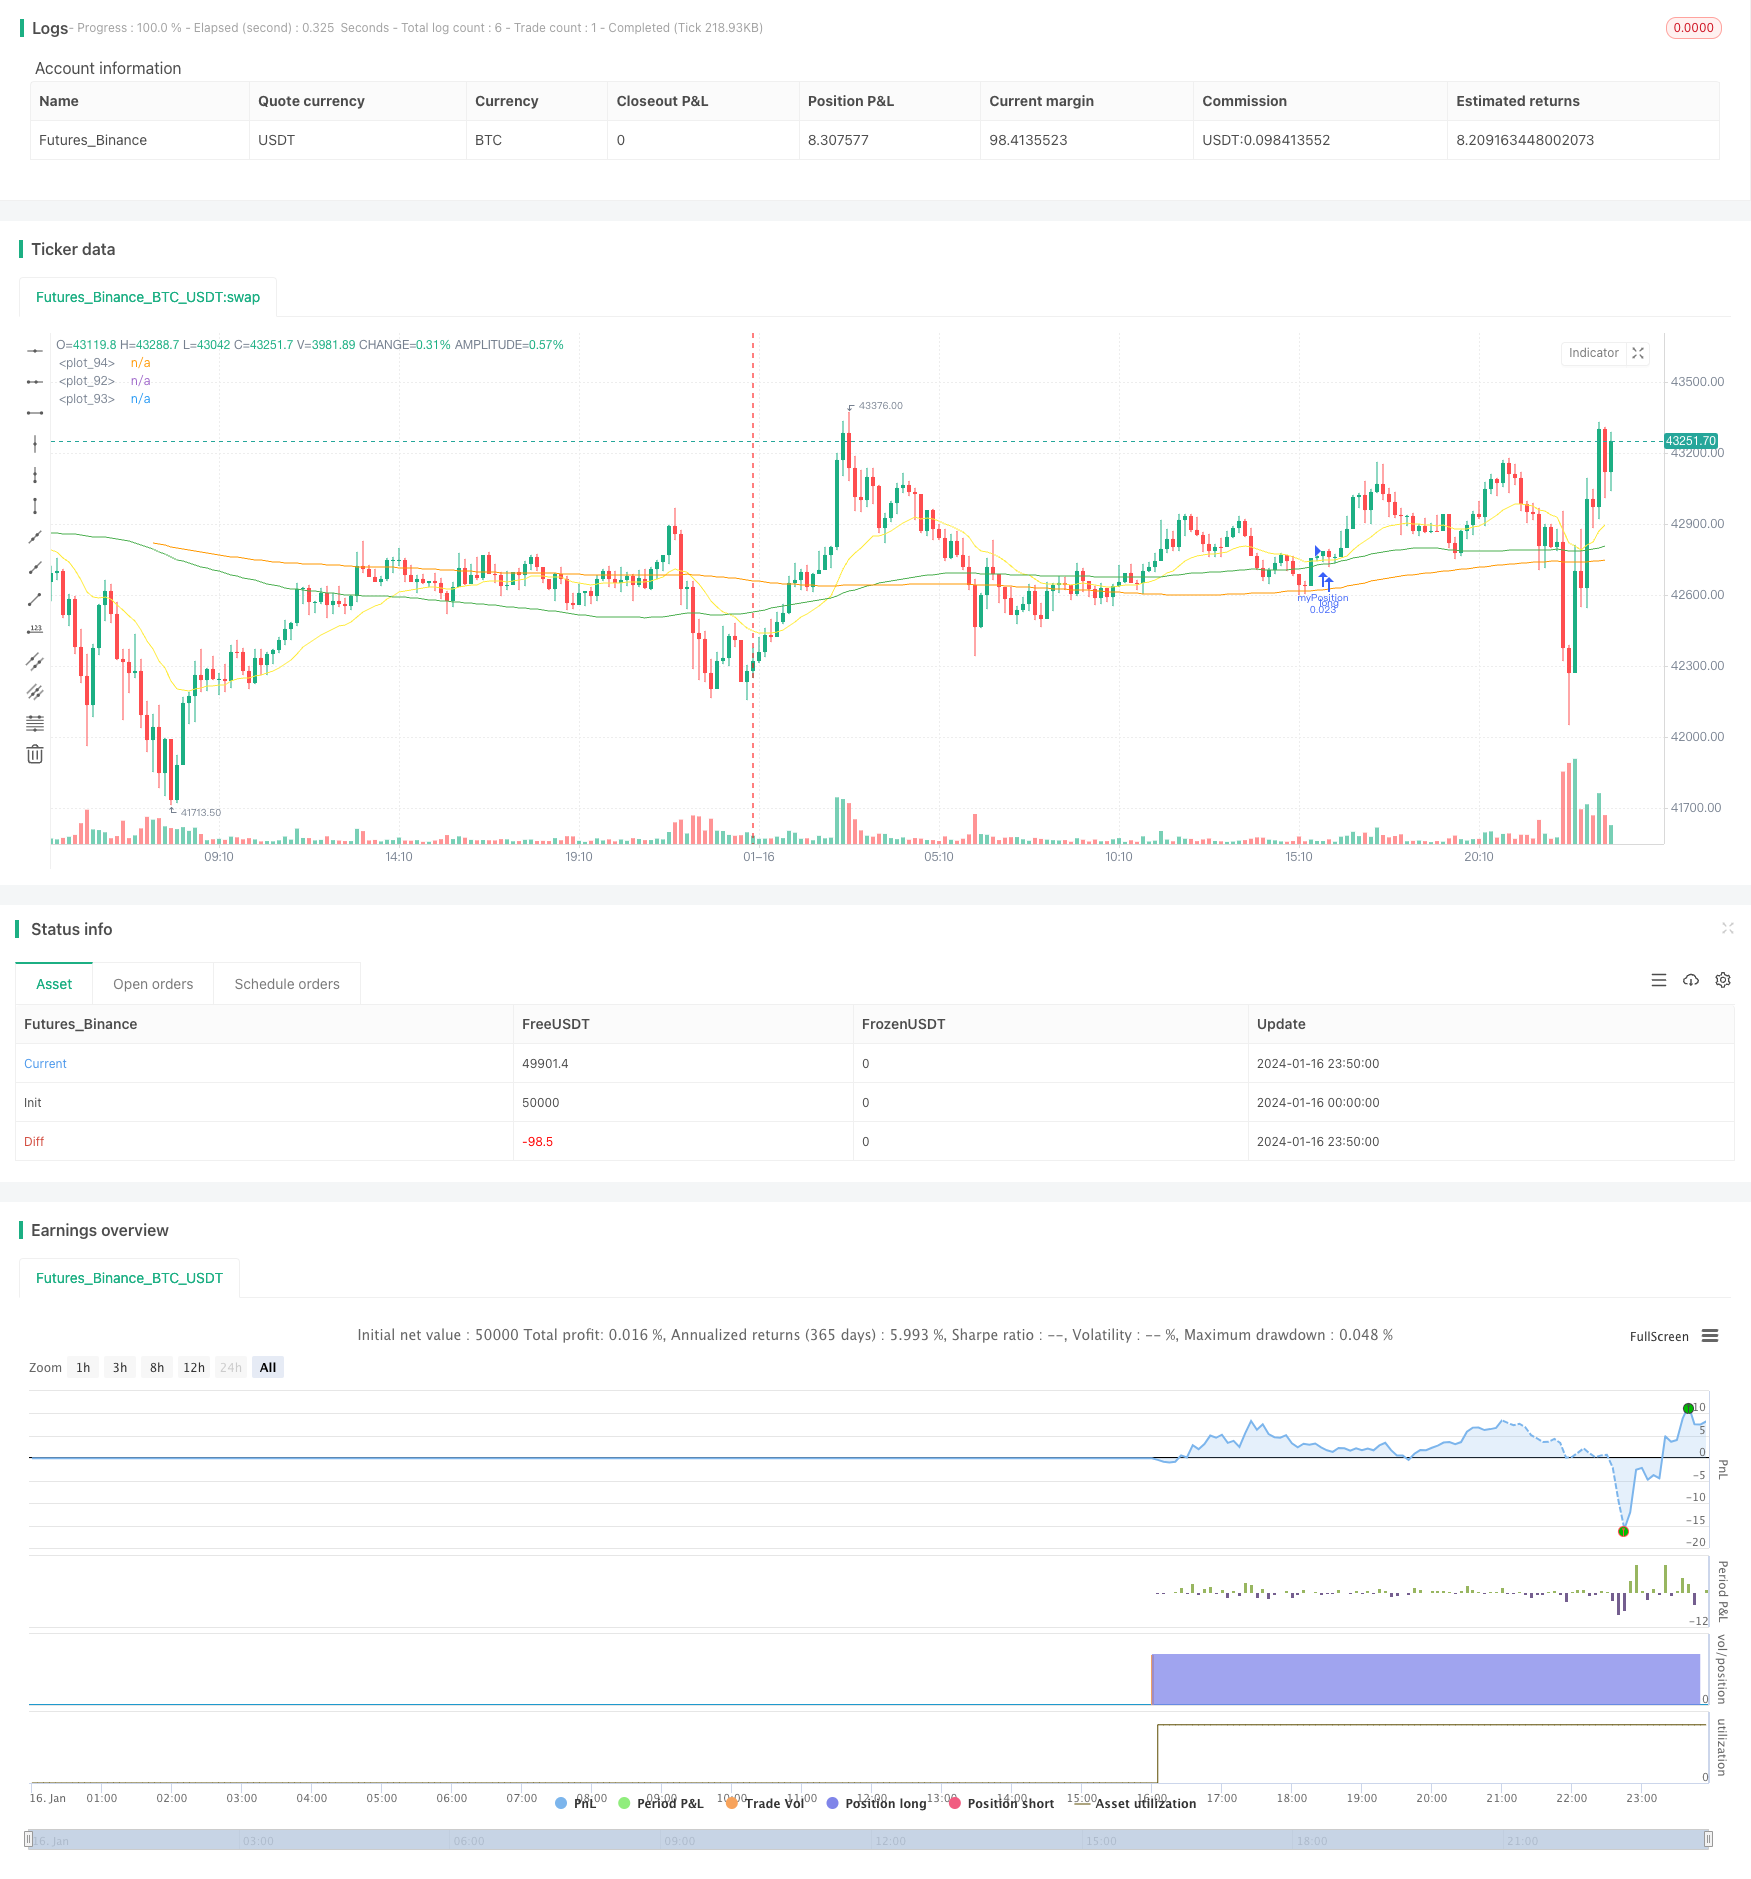
/*backtest
start: 2024-01-16 00:00:00
end: 2024-01-17 00:00:00
period: 10m
basePeriod: 1m
exchanges: [{"eid":"Futures_Binance","currency":"BTC_USDT"}]
*/

//@version=4
strategy(title="BTC_Long_Only_TV01_200507", overlay=true)

//////////// !!!!!!!!!!!!!!!! WORK BEST IN 2 HOURS for BTC, ETH and ETHXBT !!!!!!!!!!!!!!!!!!! /////////////////////
//280820 - After long esting this is the best script for ETHUSD in 4 hours. From 01/01/2020 til 28/08/2020


[macdLine, macdSignalLine, macdHist] = macd(close, 12, 26, 7)

//_rsi_len = input(14, title="RSI length")
_rsi_len = 14

NewValue = 0
PreviousValue = 0
leverage = 1

smaPercentageIncrease = 0.0
SMA_PERCENT_INCREASE = 0.0
float atrValue = 0
bool bPositionOpened = false
float stockPositionSize = 0
float volatilityPercentage = 0.0
bool bDisplayArrow = false
bool bEMAIsRising = false
bool bSMAIsRising = false
bool bSMASlowIsRising = false
bool bMACDIsRising = false
bool bMACDHistIsRising = false
bool bMACDSignalIsRising = false

float stopLoss = input (5, "StopLoss in %", type=input.float) //StopLoss associated with the order
//Best for alt versus BTC float stopLoss = input (3, "StopLoss in %", type=input.float) //StopLoss associated with the order
float positionSize = 1000
float currentPrice = close
float stopLossPrice = 0
float entryPrice = 0


//-----------------------------------------------------------


// === INPUT BACKTEST RANGE ONE YEAR
//FromDay   = input(defval = 01, title = "From Day", minval = 1, maxval = 31)
//FromMonth = input(defval = 01, title = "From Month", minval = 1, maxval = 12)
//FromYear  = input(defval = 2020, title = "From Year", minval = 2017)
FromDay   = 01
FromMonth = 01
FromYear  = 2020

//ToDay     = input(defval = 01, title = "To Day", minval = 1, maxval = 31)
//ToMonth   = input(defval = 01, title = "To Month", minval = 1, maxval = 12)
//ToYear    = input(defval = 2023, title = "To Year", minval = 2017)
ToDay     = 14
ToMonth   = 05
ToYear    = 2029

// === FUNCTION EXAMPLE ===
start     = timestamp(FromYear, FromMonth, FromDay, 00, 00)  // backtest start window
finish    = timestamp(ToYear, ToMonth, ToDay, 23, 59)        // backtest finish window
window()  => true // create function "within window of time"


//FUNCTION DEFINITIONS
//----------------------
IsRising(data, loopBack) =>
    bIsRising = true
    for n = 1 to loopBack
        if data[n] > data[n-1]
            bIsRising := false
        continue
    bIsRising

IsFalling(data, loopBack) =>
    bIsFalling = true
    for n = 1 to loopBack
        if data[n] < data[n-1]
            bIsFalling := false
        continue
    bIsFalling

// END OF FUNCTION DEFINITIONS //


emaLength = 20
smaLength = 100
smaSlowLength = 200

ema = ema(close, emaLength)
sma = sma(close, smaLength)
smaSlow = sma(close, smaSlowLength)

plot(sma, color=color.green)
plot(smaSlow, color=color.orange)
plot(ema, color=color.yellow)

//reload previous values
stopLossPrice := na(stopLossPrice[1]) ? 0.0 : stopLossPrice[1]
entryPrice := na(entryPrice[1]) ? 0.0 : entryPrice[1]
bPositionOpened := na(bPositionOpened[1]) ? false : bPositionOpened[1]
positionSize := na(positionSize[1]) ? 1000 : positionSize[1]
stockPositionSize := na(stockPositionSize[1]) ? 0 : stockPositionSize[1]
//leverage := na(leverage[1]) ? 1 : leverage[1]

bEMAIsRising := IsRising(ema, 2)
bSMAIsRising := IsRising(sma, 3)
bMACDIsRising := IsRising(macdLine, 3)
bMACDHistIsRising := IsRising(macdHist, 1)
bSMASlowIsRising := IsRising(smaSlow, 10)
bMACDSignalIsRising := IsRising(macdSignalLine, 3)


atrValue := atr(14)
volatilityPercentage := (atrValue/currentPrice)*100 //calcute the volatility. Percentage of the actual price


if (window())
    //Check if we can open a LONG
    if (bPositionOpened == false and bSMASlowIsRising == true and bMACDIsRising == true and bEMAIsRising == true and bSMAIsRising == true and ema[0] > sma[0] and sma[0] < currentPrice)
        //Enter in short position
        stockPositionSize := (positionSize*leverage)/currentPrice //Calculate the position size based on the actual price and the position Size (in $) configured.

        //calculate exit values
        stopLossPrice := currentPrice*(1-stopLoss/100)
        strategy.entry("myPosition", strategy.long, qty=stockPositionSize, comment="BUY at " + tostring(currentPrice))
        entryPrice := currentPrice //store the entry price
        bPositionOpened := true
        bDisplayArrow := true

    if (bPositionOpened == true and (currentPrice <= stopLossPrice or crossunder(ema[1], sma[1])))
        strategy.close("myPosition", comment="" + tostring(currentPrice) ) //Stop
        //uncomment the below line to make the bot investing the full portfolio amount to test compounding effect.
        //positionSize := positionSize + ((stockPositionSize * currentPrice) - (positionSize*leverage))
        //reset some flags
        bPositionOpened := false
        bDisplayArrow := true
        entryPrice := 0.0