Parabolic SAR Trend Tracking Strategy

Overview
This strategy utilizes Parabolic SAR (Stop and Reverse) indicator combined with EMA filtering to improve signal accuracy. It is suitable for traders who trade with the trend.
Strategy Logic
A long signal is triggered when SAR is below price and price is above slow EMA plus offset. A short signal is triggered when SAR is above price and price is below slow EMA minus offset. Crossover between fast EMA and slow EMA provides additional filtering. This avoids false signals when using SAR alone.
Specifically, long entry conditions are:
- SAR is below previous close and above current close;
- Current close is above slow EMA plus offset or fast EMA crosses below slow EMA;
- Current close is above SAR value and slow EMA plus offset.
Short entry conditions are:
- SAR is above previous close and below current close;
- Current close is below slow EMA minus offset or fast EMA crosses above slow EMA;
- Current close is below SAR value and slow EMA minus offset.
Advantage Analysis
Combining SAR and EMA filtering, this strategy can identify trend direction well and reduce false signals.
Advantages are:
- SAR can respond quickly to price changes and identify trend reversal points.
- EMA filtering further confirms trend direction and avoids false signals when using SAR alone.
- Crossover between fast and slow EMA provides additional signal accuracy.
- Profitability can be improved through parameter optimization.
Risk Analysis
There are some risks to this strategy:
- SAR and EMA may generate incorrect signals during range-bound markets, impacting profitability. This can be reduced through parameter optimization.
- EMA has lagging effect and may miss best entry points when trend reverses. Lagging effect can be reduced by shortening EMA periods.
- Stop loss may get hit easily during high volatility, causing higher losses. Stop loss range can be widened appropriately.
Optimization Directions
This strategy can be optimized from the following aspects:
- Optimize SAR parameters like step and maximum to make it more sensitive.
- Optimize slow and fast EMA periods to find optimal combinations.
- Optimize EMA offset to reduce false signals.
- Add other indicators like MACD and KDJ for additional filtering and accuracy.
- Optimize stop loss strategy to reduce losses per trade.
Conclusion
This strategy combines the strengths of SAR and EMA to design a flexible trend following system. Overall it has good trend detection capability and works well in tracking trends. Further enhancements in parameter optimization and risk management can improve stability and profitability. It suits investors with good risk management awareness and optimization skills.
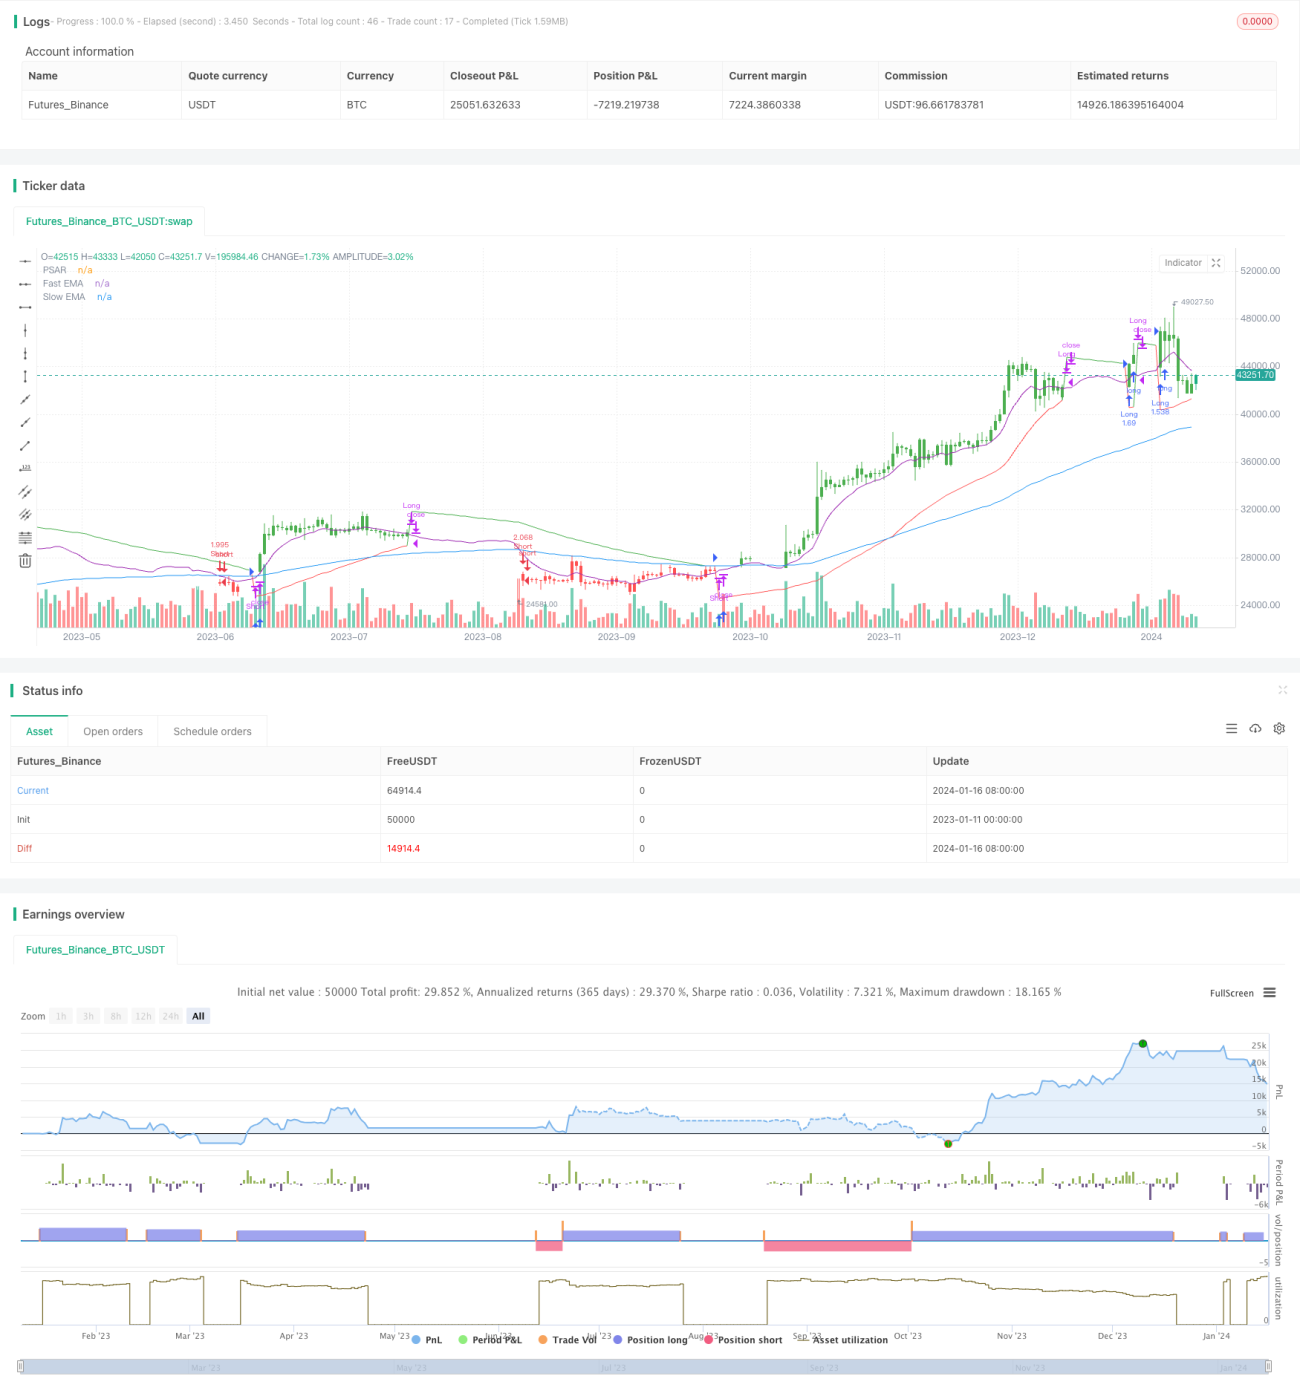
/*backtest
start: 2023-01-11 00:00:00
end: 2024-01-17 00:00:00
period: 1d
basePeriod: 1h
exchanges: [{"eid":"Futures_Binance","currency":"BTC_USDT"}]
*/

//@version=3
strategy("SAR Trend Trader Strategy By: jhanson107", shorttitle="SAR Trend Trader Strategy", overlay=true, default_qty_type=strategy.percent_of_equity, default_qty_value=100)
- 1