概述
动态支撑阻力通道突破策略是一个识别关键支撑阻力位和突破信号的强大策略。该策略在图表上可视化这些关键级别,使交易者容易发现潜在的交易机会。
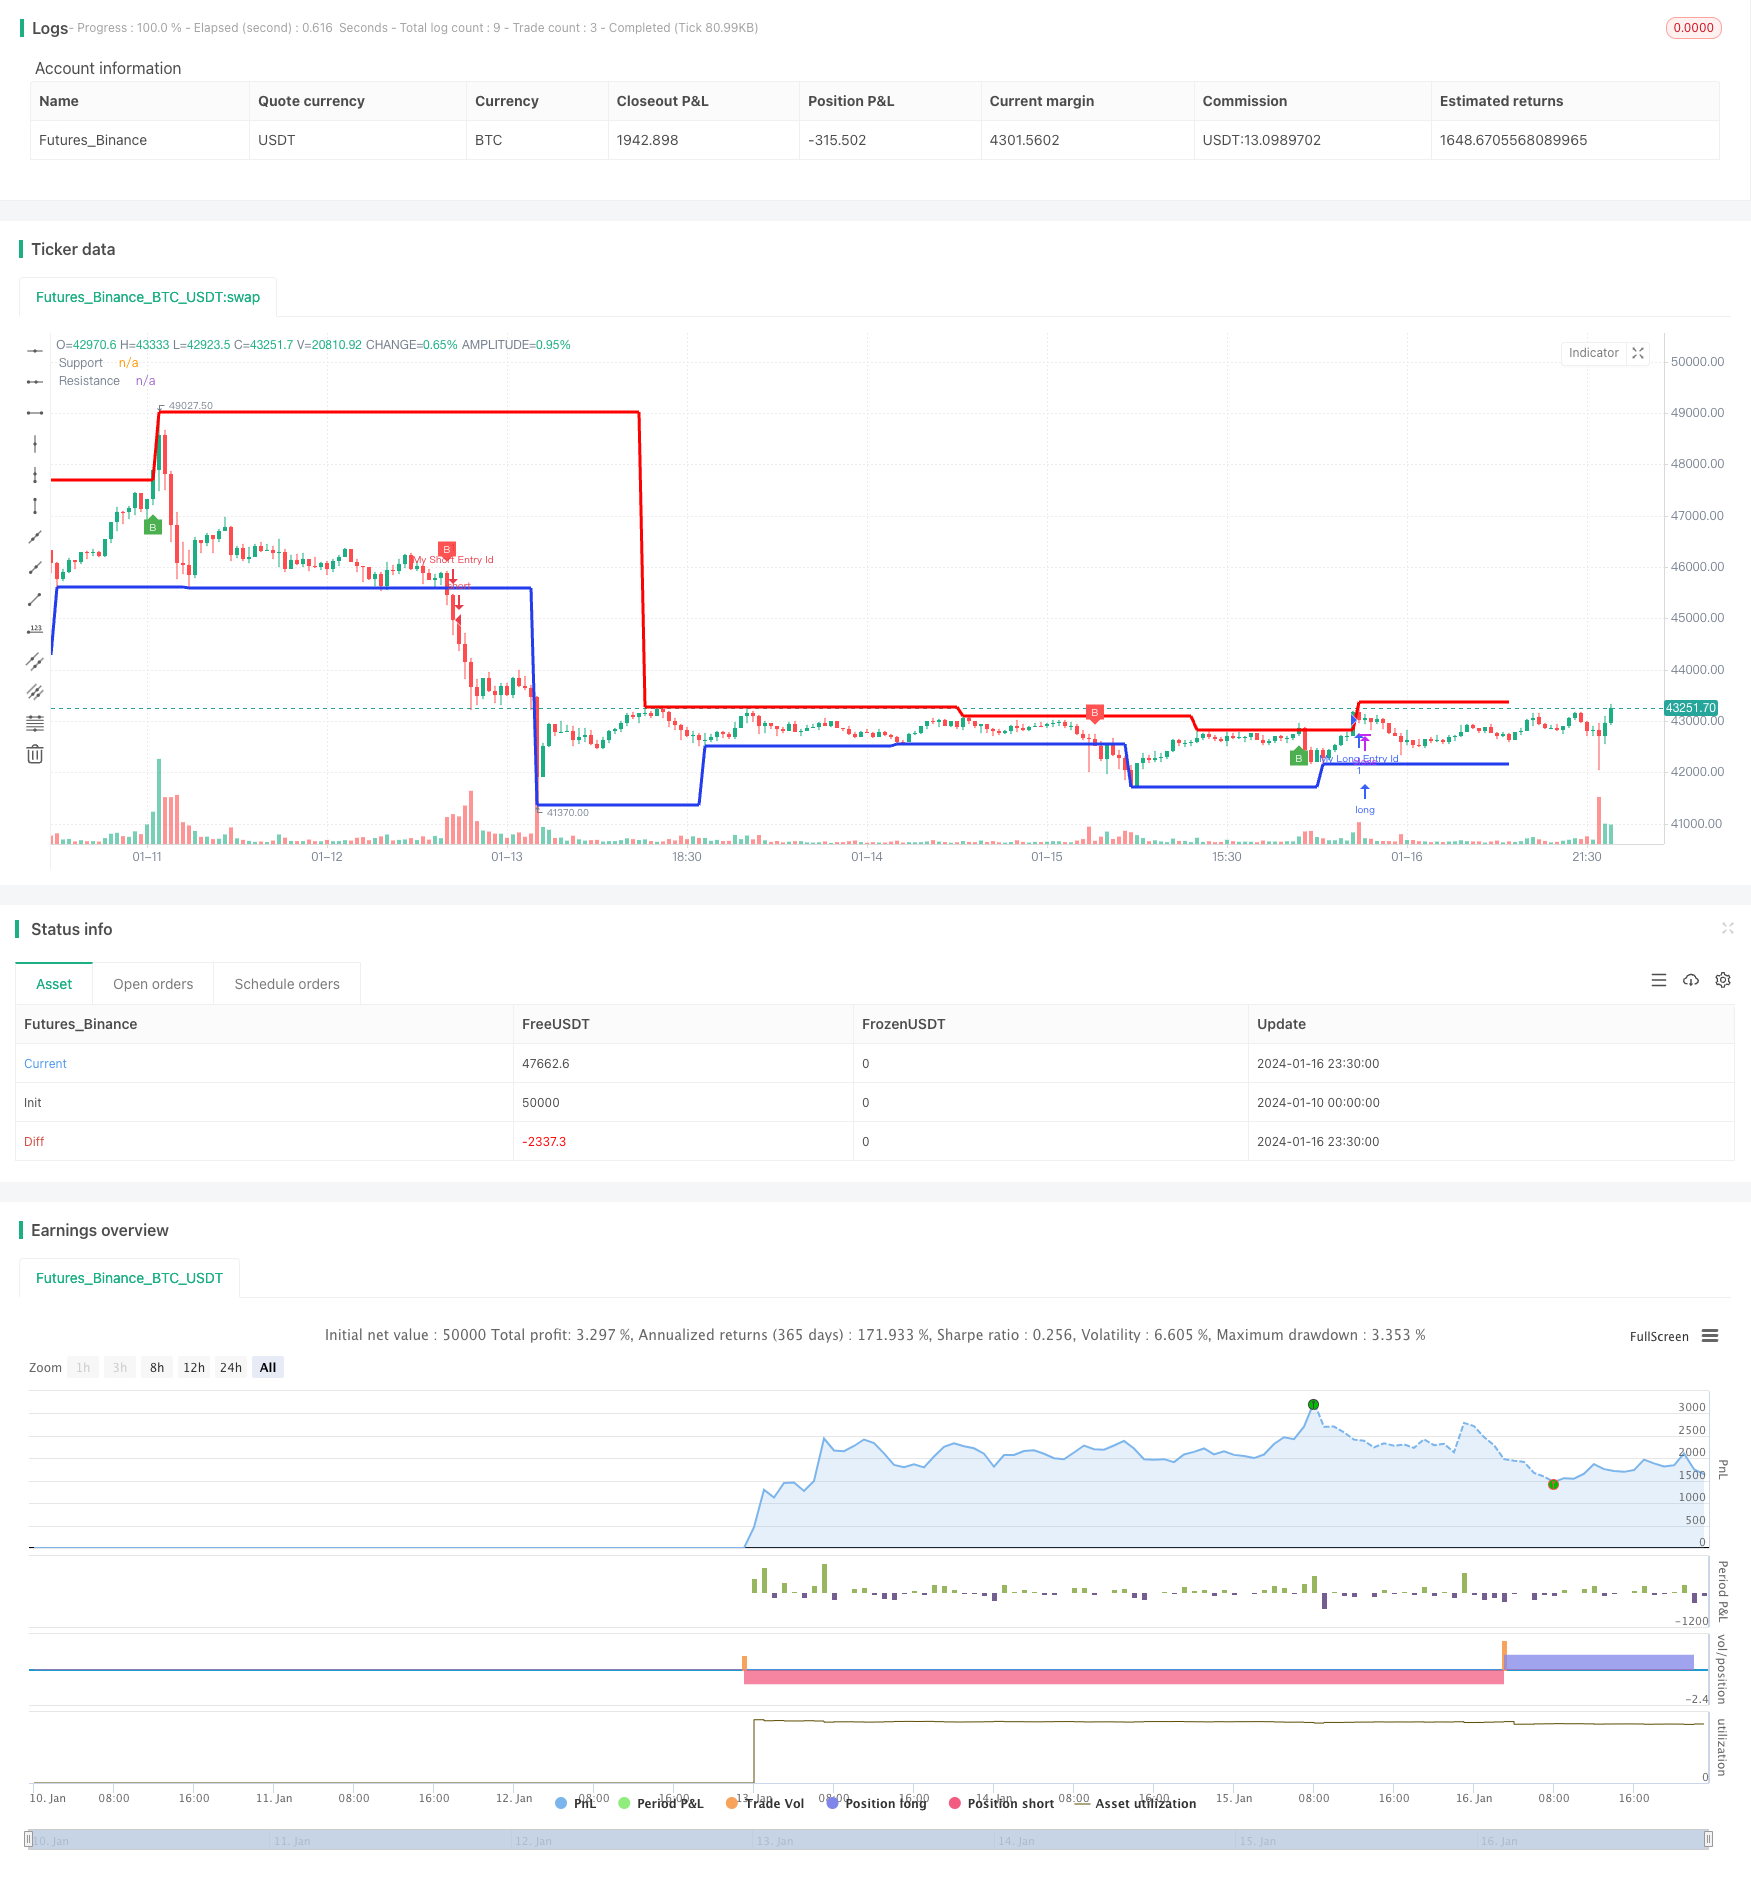
策略原理
该策略基于用户定义的左栏和右栏动态计算支撑阻力位。这提供了适应变化市场条件的灵活性。当收盘价跨过这些支撑阻力位时,并结合成交量验证,产生买入和卖出信号。此外,该策略集成了基于定义的支撑阻力条件自动执行多头或空头仓位的交易策略,使整个交易流程更加流畅。
具体来说,策略通过ta.pivotlow和ta.pivothigh函数计算出动态的支撑和阻力位。这些支撑阻力线以红色和蓝色在图表上绘制。当收盘价突破这些位时,在突破位置绘制B形状的标记。同时,策略结合5日和10日平均成交量的振荡器判断成交量激增。只有在成交量足够大的情况下,才会触发突破信号和发送警报。最后,该策略整合了基于这些支撑阻力位和成交量条件的 LONG/SHORT 入市和出场策略。
策略优势
该策略具有以下优势:
- 动态支撑阻力位适应市场变化
- 成交量验证确保突破的重要性
- 图形标记和警报使关键点突出
- 整合的交易策略简化交易流程
- 可自定义的参数提高适用性
总的来说,该策略完整地识别、可视化和利用关键的支撑阻力突破点,为交易者选择最佳的交易时机提供了巨大的便利,极大地提高了交易的成功率。
策略风险
该策略潜在的风险主要有:
突破失效风险。突破点可能形成虚假突破。这可能导致不必要的损失。可以通过设置更严格的成交量和价格波动确认条件来缓解。
参数优化风险。如果左栏和右栏等参数设置不当,则计算出的支撑阻力位可能不准确。应根据不同品种的交易特点,选择合适的左栏和右栏。
过度优化风险。参数优化过度可能导致策略过拟合。应适当进行回测和验证,避免在少量数据上过度优化策略。
交易成本风险。频繁交易会导致较高的手续费。应适当考虑调整获利因子或通过其他方式控制交易频率。
策略优化方向
该策略可从以下几个方向进行优化:
添加止损条件,控制单笔损失。
优化获利因子,寻找最佳获利点。
测试不同参数组合确定最佳参数。
根据不同品种调整左栏和右栏设置。
添加其他过滤条件,如价格波动率,更准确判断突破的可能性。
尝试不同的成交量确认指标。例如放量突破等。
结合不同的交易策略或指标实现更优的整合。
总结
动态支撑阻力通道突破策略利用图表技术分析的支撑阻力概念,辅以成交量分析确认突破重要性,能有效发现市场的关键转折点。该策略简明易用的界面设计、指标绘制与信号提示使复杂的技术指标内容易于理解,极大地降低了技术门槛。同时,可自定义和整合的参数设置使其易于与交易者自身的策略实施相结合。综上所述,该策略是一个功能全面且实用性强的量化交易策略。
/*backtest
start: 2024-01-10 00:00:00
end: 2024-01-17 00:00:00
period: 30m
basePeriod: 15m
exchanges: [{"eid":"Futures_Binance","currency":"BTC_USDT"}]
*/

//@version=5
strategy("Support and Resistance channel with Breaks p5", shorttitle="Support and Resistance channel with Breaks [cryptoonchain]", overlay=true, max_bars_back=1000)

// Input variables
toggleBreaks = input(true, title="Show Breaks")
leftBars = input(15, title="Left Bars")
rightBars = input(15, title="Right Bars")
volumeThresh = input(20, title="Volume Threshold")

// Calculate pivot levels
highUsePivot = fixnan(ta.pivothigh(leftBars, rightBars)[1])
lowUsePivot = fixnan(ta.pivotlow(leftBars, rightBars)[1])

// Plot resistance and support lines
r1 = plot(highUsePivot, color=color.new(na(highUsePivot) ? na : #FF0000, 0), linewidth=3, offset=-(rightBars + 1), title="Resistance")
s1 = plot(lowUsePivot, color=color.new(na(lowUsePivot) ? na : #233dee, 0), linewidth=3, offset=-(rightBars + 1), title="Support")

// Volume %
short = ta.ema(volume, 5)
long = ta.ema(volume, 10)
osc = 100 * (short - long) / long

// Plot shapes for breaks with volume
plotshape(toggleBreaks and ta.crossunder(close, lowUsePivot) and not (open - close < high - open) and osc > volumeThresh, title="Break", text='B', style=shape.labeldown, location=location.abovebar, color=color.red, textcolor=color.white, transp=0, size=size.tiny)
plotshape(toggleBreaks and ta.crossover(close, highUsePivot) and not (open - low > close - open) and osc > volumeThresh, title="Break", text='B', style=shape.labelup, location=location.belowbar, color=color.green, textcolor=color.white, transp=0, size=size.tiny)

// Alert conditions
alertcondition(ta.crossunder(close, lowUsePivot) and osc > volumeThresh, title="Support Broken", message="Support Broken")
alertcondition(ta.crossover(close, highUsePivot) and osc > volumeThresh, title="Resistance Broken", message="Resistance Broken")

// Strategy conditions with filter
longCondition = low > highUsePivot and osc > volumeThresh
shortCondition = high < lowUsePivot and osc > volumeThresh


// Strategy entries
strategy.entry("My Long Entry Id", strategy.long, when=longCondition)
strategy.entry("My Short Entry Id", strategy.short, when=shortCondition)