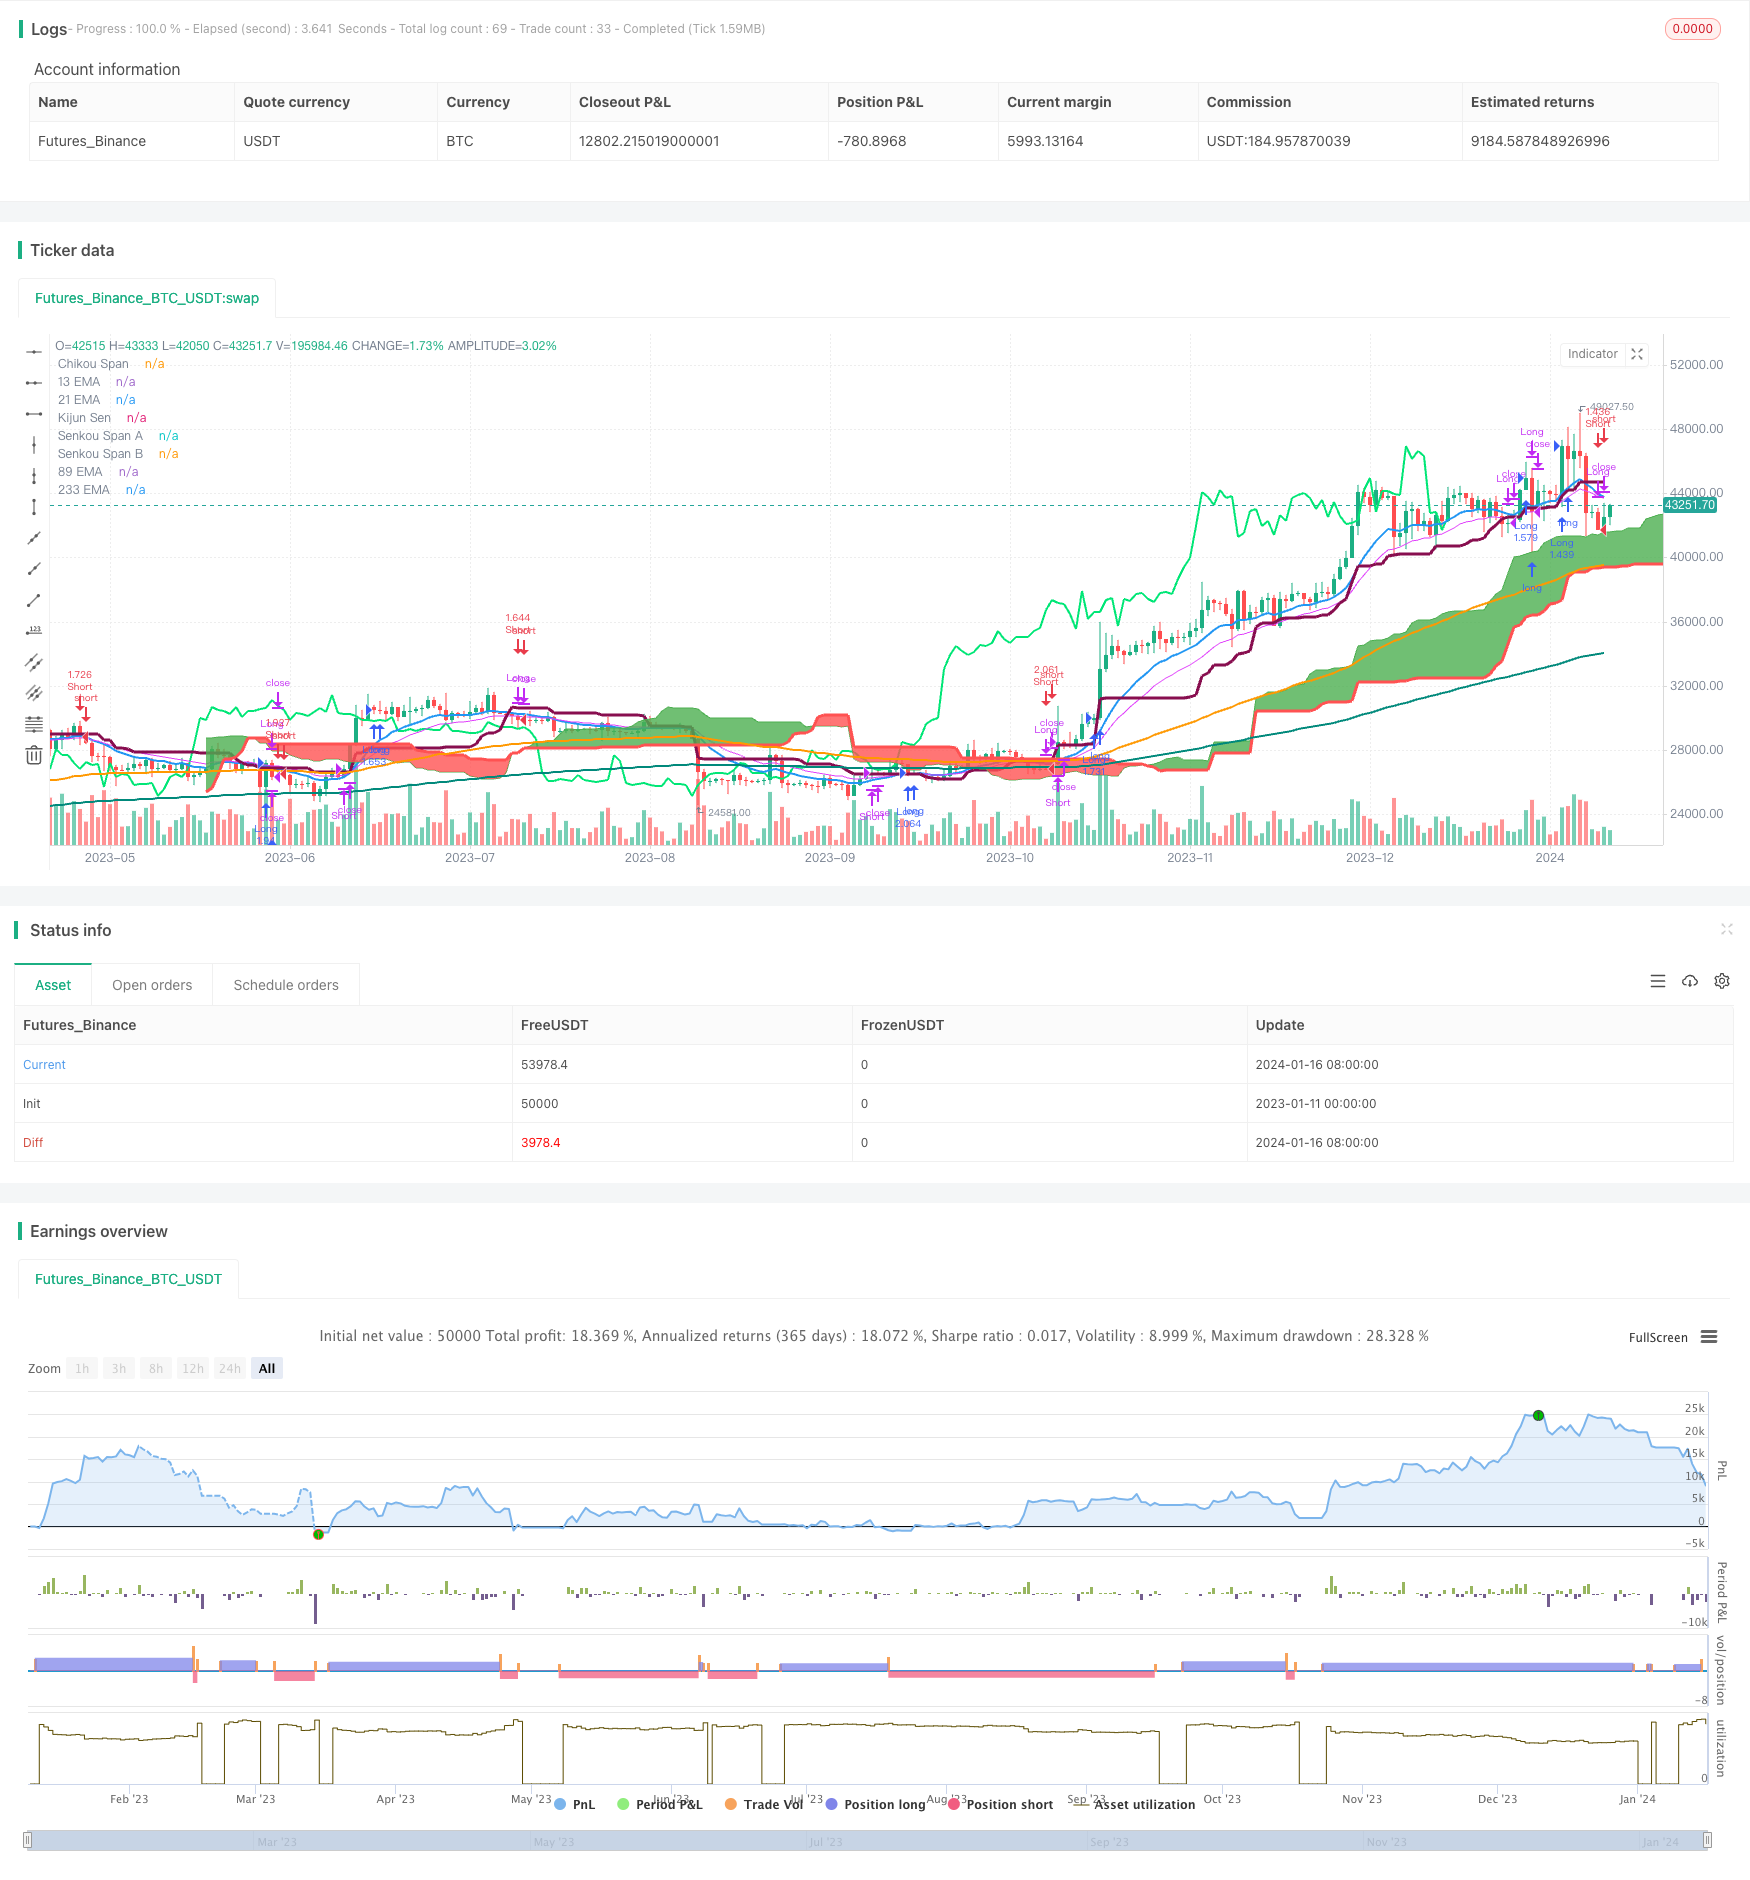
概述
本策略结合了移动平均线、相对强弱指标(RSI)以及一目均衡表指标,目标是识别股票价格的趋势,并在趋势背景下进行交易。核心思路是当短期平均线上穿中长期平均线,并在一目均衡表的云团上方突破时,产生买入信号;当短期平均线下穿中长期平均线,并在云团下方突破时,产生卖出信号。
策略原理
本策略使用13日、21日、89日和233日四条移动平均线。13日线代表短期趋势,233日线代表长期趋势,21日线和89日线在中期。当短期平均线上穿中长期平均线时,表示股价走势由跌转涨,产生买入信号。反之,短期平均线下穿中长期平均线则为卖出信号。
此外,本策略还结合一目均衡表指标中的转换线、基准线和前沿线。转换线采用9日移动平均值,基准线采用26日移动平均值,前沿线则采用中短期移动平均值。当价格上穿前沿线时为买入信号,下穿为卖出信号。
最后,策略还采用RSI指标中的12日线和24日线。12日线代表短期为超买超卖情况,24日线代表中期的超买超卖情况。策略通过判断12日RSI线与24日RSI线的交叉情况来确认交易信号。
策略优势
- 结合移动平均线识别趋势方向
- 一目均衡表判断进入和退出的时机
- RSI指标避免虚假突破
本策略能够非常好地识别股票价格的主要趋势方向。移动平均线结合一目均衡表指标,使买入卖出信号更加准确。此外,RSI指标的引入也避免了可能的虚假突破情况。总的来说,本策略集多个指标优势于一身,可以有效锁定主要趋势,从中获利。
风险分析
趋势反转风险
交易者需要密切关注行情变化,一旦出现价格触碰平均线的迹象就要提高警惕,及时平仓。参数优化空间
移动平均线的周期设置、一目均衡表参数等都有优化的空间,交易者可以根据不同品种选择最优参数组合。交易频率偏高
策略的交易频率会比较高,需要充分考量手续费的问题。可以适当调整参数,减少不必要的交易。
优化方向
增加止损止盈策略
目前策略没有设置止损止盈逻辑,这会带来一定的风险。后期可以考虑在策略中加入此类模块。参数优化
针对不同的交易品种,可以对移动平均线周期、一目均衡表参数、RSI周期等进行优化,找到最佳的组合。这可以进一步提高策略的稳定性。结合更多指标
除了已使用的指标,还可以考虑结合波动率、交易量变化等其他衍生指标,形成更全面的判断依据。
总结
本策略结合移动平均线、相对强弱指标和一目均衡表指标,可以有效识别证券价格的主要趋势,属于比较典型的趋势跟踪策略。策略的优势在于指标组合全面,可以很好地把握趋势;但交易频率较高,也存在一定程度的回撤风险。通过引入止损止盈、参数优化等手段,本策略的效果还有提升的空间。总体而言,本策略是一种稳定、可靠的趋势策略,适合那些有一定风险承受能力并希望持续获利的投资者。
/*backtest
start: 2023-01-11 00:00:00
end: 2024-01-17 00:00:00
period: 1d
basePeriod: 1h
exchanges: [{"eid":"Futures_Binance","currency":"BTC_USDT"}]
*/

//@version=3

strategy("EMA + Ichimoku Kinko Hyo Strategy", shorttitle="EMI", overlay=true, default_qty_type=strategy.percent_of_equity, max_bars_back=1000, default_qty_value=100, calc_on_order_fills= true, calc_on_every_tick=true, pyramiding=0)

TenkanSenPeriods = input(9, minval=1, title="Tenkan Sen Periods")
KijunSenPeriods = input(26, minval=1, title="Kijun Sen Periods")
SenkouSpanBPeriods = input(52, minval=1, title="Senkou Span B Periods")
displacement = input(26, minval=1, title="Displacement")
donchian(len) => avg(lowest(len), highest(len))
TenkanSen = donchian(TenkanSenPeriods)
KijunSen = donchian(KijunSenPeriods)
SenkouSpanA = avg(TenkanSen, KijunSen)
SenkouSpanB = donchian(SenkouSpanBPeriods)
SenkouSpanH = max(SenkouSpanA[displacement - 1], SenkouSpanB[displacement - 1])
SenkouSpanL = min(SenkouSpanA[displacement - 1], SenkouSpanB[displacement - 1])
ChikouSpan = close[displacement-1]

Sema = ema(close, 13)
Mema = ema(close, 21)
Lema = ema(close, 89)
XLema = ema(close, 233)

plot(Sema, color=blue, title="13 EMA", linewidth = 2)
plot(Mema, color=fuchsia, title="21 EMA", linewidth = 1)
plot(Lema, color=orange, title="89 EMA", linewidth = 2)
plot(XLema, color=teal, title="233 EMA", linewidth = 2)
plot(KijunSen, color=maroon, title="Kijun Sen", linewidth = 3)
plot(close, offset = -displacement, color=lime, title="Chikou Span", linewidth = 2)
sa=plot (SenkouSpanA, offset = displacement, color=green,  title="Senkou Span A", linewidth = 1)
sb=plot (SenkouSpanB, offset = displacement, color=red,  title="Senkou Span B", linewidth = 3)
fill(sa, sb, color = SenkouSpanA > SenkouSpanB ? green : red)

longCondition = (rsi(close, 12)>rsi(close, 24)) and close>ChikouSpan and Sema>KijunSen
strategy.entry("Long",strategy.long,when = longCondition)

strategy.close("Long", when = (rsi(close, 12)<rsi(close, 24) and (close<KijunSen and close<ChikouSpan)))

shortCondition = (rsi(close, 12)<rsi(close, 24)) and close<ChikouSpan and Sema<KijunSen
strategy.entry("Short",strategy.short, when = shortCondition)

strategy.close("Short", when = (rsi(close, 12)>rsi(close, 24) and (close>KijunSen and close>ChikouSpan)))