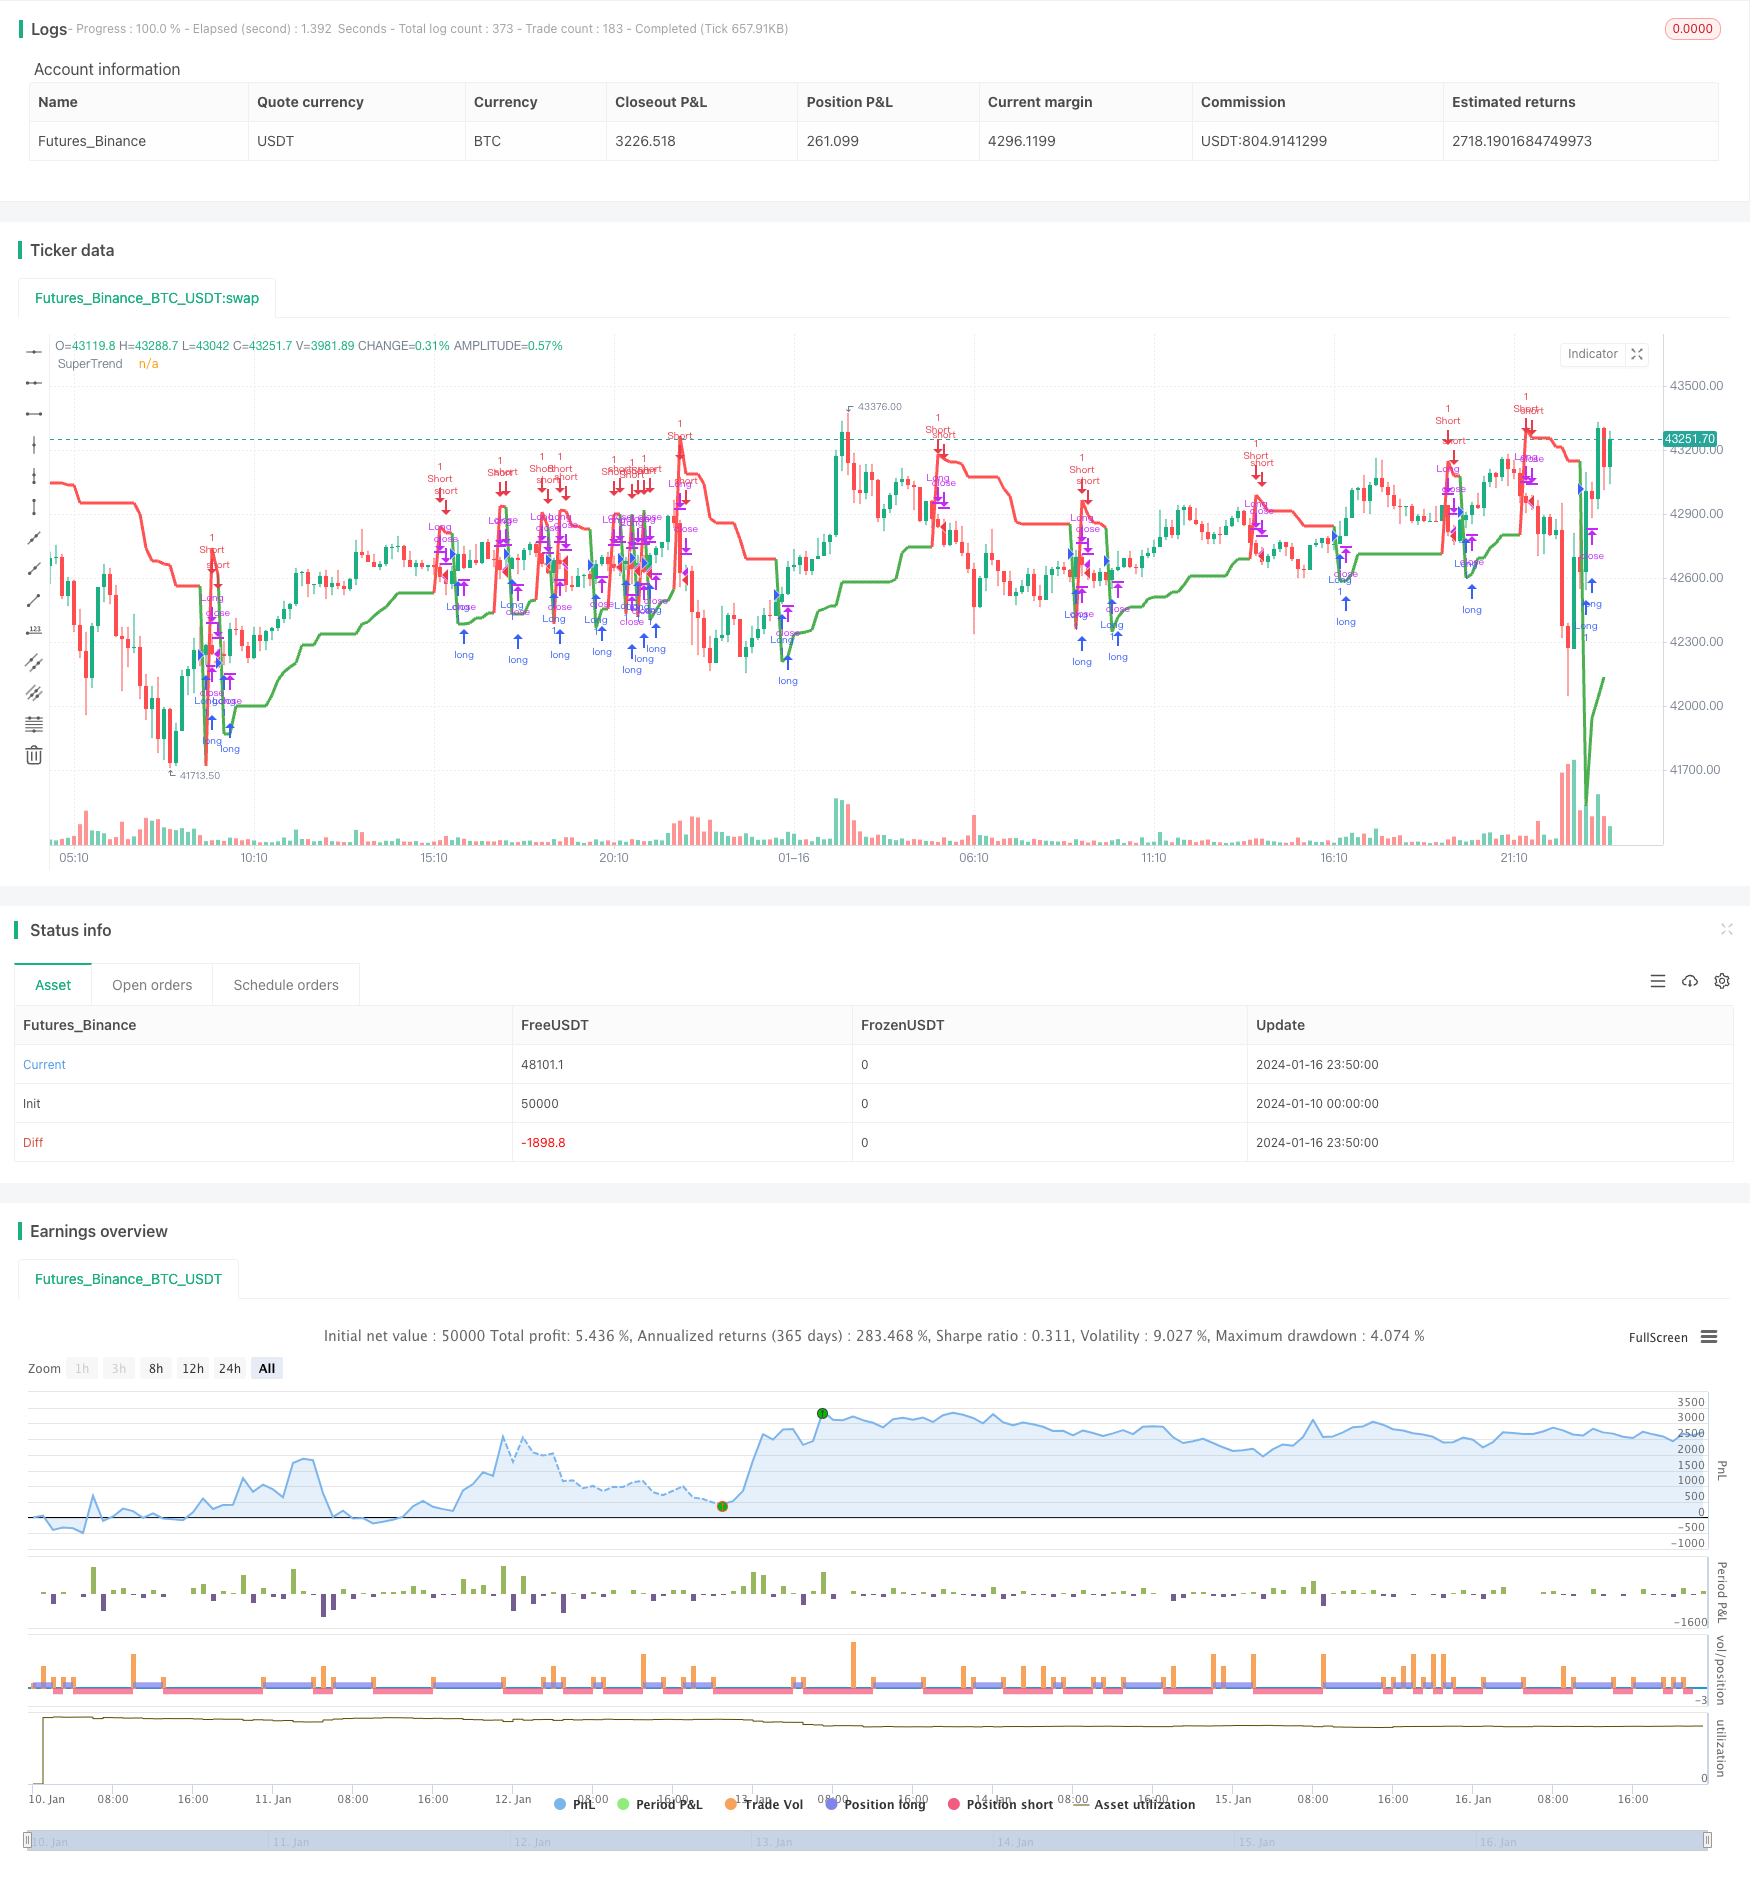
概述
本策略融合了超级趋势指标和商品通道指数(CCI)指标,实现了一个多时间框架的趋势追踪和交易信号生成。该策略的主要思想是利用CCI指标判断短期趋势方向,同时结合超级趋势指标判断中长期趋势方向。当短期和中长期趋势一致时,产生交易信号。
策略原理
CCI指标判断短期趋势
CCI指标能判断超买超卖现象,当CCI指标从下向上穿过0轴线时为多头信号,反之为空头信号。本策略即利用这一特性,判断短期趋势方向。
cci_period = input(28, "CCI Period")
cci = cci(source, cci_period)
ML = input(0, "CCI Mid Line pivot")
以上代码定义了CCI指标的周期和中轴线位置。
TrendUp := cci[1] > ML ? max(Up,TrendUp[1]) : Up
TrendDown := cci[1]< ML ? min(Dn,TrendDown[1]) : Dn
这部分代码判断cci是否上穿0轴线,如果是则更新超级趋势的上轨,下穿则更新下轨。
超级趋势指标判断中长期趋势
超级趋势指标通过将ATR指标与价格进行组合,能判断中长期趋势的方向。当价格突破超级趋势的上轨时为多头信号,下轨为空头信号。
本策略中超级趋势指标的计算公式如下:
Up=hl2-(Factor*atr(Pd))
Dn=hl2+(Factor*atr(Pd))
其中Factor和Pd为可调节的参数。
Trend变量判断超级趋势的当前方向:
Trend := cci > ML ? 1: cci < ML ? -1: nz(Trend[1],1)
整合CCI和超级趋势
通过整合CCI指标和超级趋势指标,本策略实现了多时间框架下的趋势判断。CCI指标捕捉短期趋势,超级趋势指标判断中长期趋势。
当二者方向一致时,产生更可靠的交易信号。
isLong  = st_trend == 1
isShort = st_trend == -1
入场时机为短期和中长期同向,出场时机为短期和中长期反向。
策略优势
多时间框架判断
本策略同时整合了短期和中长期趋势判断指标,使交易信号更加可靠。
参数可调
超级趋势指标中的Factor参数和CCI指标的cci_period可根据市场调整,使策略更具灵活性。
简单清晰
策略结构简单清晰,容易理解和实现,非常适合量化交易初学者。
适用范围广
可适用于股票、外汇、加密货币等市场,也可根据参数设置调整适用不同品种。
策略风险及解决方法
价格震荡大
当价格波动剧烈时,会出现许多虚假信号。可适当调大超级趋势的Factor参数,降低策略的交易频率。
追随强势不足
超级趋势本身对强势的追随并不足够,可考虑与动量指标结合,在趋势加速阶段追踪趋势。
停损策略
本策略没有设置止损,可结合ATR指标的大小设置 trails 止损。
策略优化方向
市场相关性
根据不同市场的特点,调整超级趋势和CCI的参数,提高策略稳定性。
动量指标结合
与MACD,KDJ等动量指标结合,在趋势加速阶段追踪趋势,可获得更高收益。
集成学习
使用机器学习和集成学习方法对策略参数和交易规则进行优化。
总结
本策略成功结合超级趋势和CCI指标,实现了多时间框架下的趋势判断。策略简单易懂,参数可调,收益潜力较大。可通过调参、止损和集成学习等方式进一步优化,使之成为一个可靠、稳定、高效的交易策略。
/*backtest
start: 2024-01-10 00:00:00
end: 2024-01-17 00:00:00
period: 10m
basePeriod: 1m
exchanges: [{"eid":"Futures_Binance","currency":"BTC_USDT"}]
*/

//@version=4
//@author=Daveatt

StrategyName = "Best Supertrend CCI Strategy"
ShortStrategyName = "Best Supertrend CCI Strategy"

strategy(title=StrategyName, shorttitle=ShortStrategyName, overlay=true )

//////////////////////////
//* COLOR CONSTANTS *//
//////////////////////////

AQUA = #00FFFFFF
BLUE = #0000FFFF
RED  = #FF0000FF
LIME = #00FF00FF
GRAY = #808080FF
DARKRED   = #8B0000FF
DARKGREEN = #006400FF
GOLD = #FFD700
WHITE = color.white

// Plots
GREEN_LIGHT     = color.new(color.green, 40)
RED_LIGHT       = color.new(color.red, 40)
BLUE_LIGHT      = color.new(color.aqua, 40)
PURPLE_LIGHT    = color.new(color.purple, 40)

source = input(close)

///////////////////////////////////////////////////////////////////////////////
///////////////////////////////////////////////////////////////////////////////
/////////////////////////////////// CCI /////////////////////////////////////
///////////////////////////////////////////////////////////////////////////////
///////////////////////////////////////////////////////////////////////////////

cci_period = input(28, "CCI Period")
cci = cci(source, cci_period)
//UL = input(80, "Upper level")
//LL = input(20, "Lower Level")
ML = input(0, "CCI Mid Line pivot")

///////////////////////////////////////////////////////////////////////////////
///////////////////////////////////////////////////////////////////////////////
///////////////////////////// SUPERTREND /////////////////////////////////////
///////////////////////////////////////////////////////////////////////////////
///////////////////////////////////////////////////////////////////////////////

Factor=input(3,title="[ST] Factor", minval=1,maxval = 100, type=input.float)
Pd=input(3, title="[ST] PD", minval=1,maxval = 100)

///////////////////////////////////////////////////////////////////////////////
///////////////////////////////////////////////////////////////////////////////
/////////////////////// SUPERTREND DETECTION //////////////////////////////////
///////////////////////////////////////////////////////////////////////////////
///////////////////////////////////////////////////////////////////////////////

f_supertrend(Factor, Pd) =>

    Up=hl2-(Factor*atr(Pd))
    Dn=hl2+(Factor*atr(Pd))

    TrendUp = 0.0
    TrendUp := cci[1] > ML ? max(Up,TrendUp[1]) : Up
    TrendDown = 0.0
    TrendDown := cci[1]< ML ? min(Dn,TrendDown[1]) : Dn
    Trend = 0.0
    Trend := cci > ML ? 1: cci < ML ? -1: nz(Trend[1],1)
    Tsl = Trend==1? TrendUp: TrendDown

    [Trend, Tsl]

[st_trend, st_tsl] = f_supertrend(Factor, Pd)

// Plot the ST
linecolor = close >= st_tsl ? color.green : color.red
plot(st_tsl, color = linecolor , linewidth = 3,title = "SuperTrend", transp=0)

isLong  = st_trend == 1
isShort = st_trend == -1

longClose   = isLong[1] and isShort
shortClose  = isShort[1] and isLong

strategy.entry("Long", 1, when=isLong)
strategy.close("Long", when=longClose )

strategy.entry("Short", 0,  when=isShort)
strategy.close("Short", when=shortClose )