资源加载中... loading...

Quant Trading Support and Resistance Cloud Indicator

Author: ChaoZhang, Date: 2024-01-18 15:30:46
Tags:

img

Overview

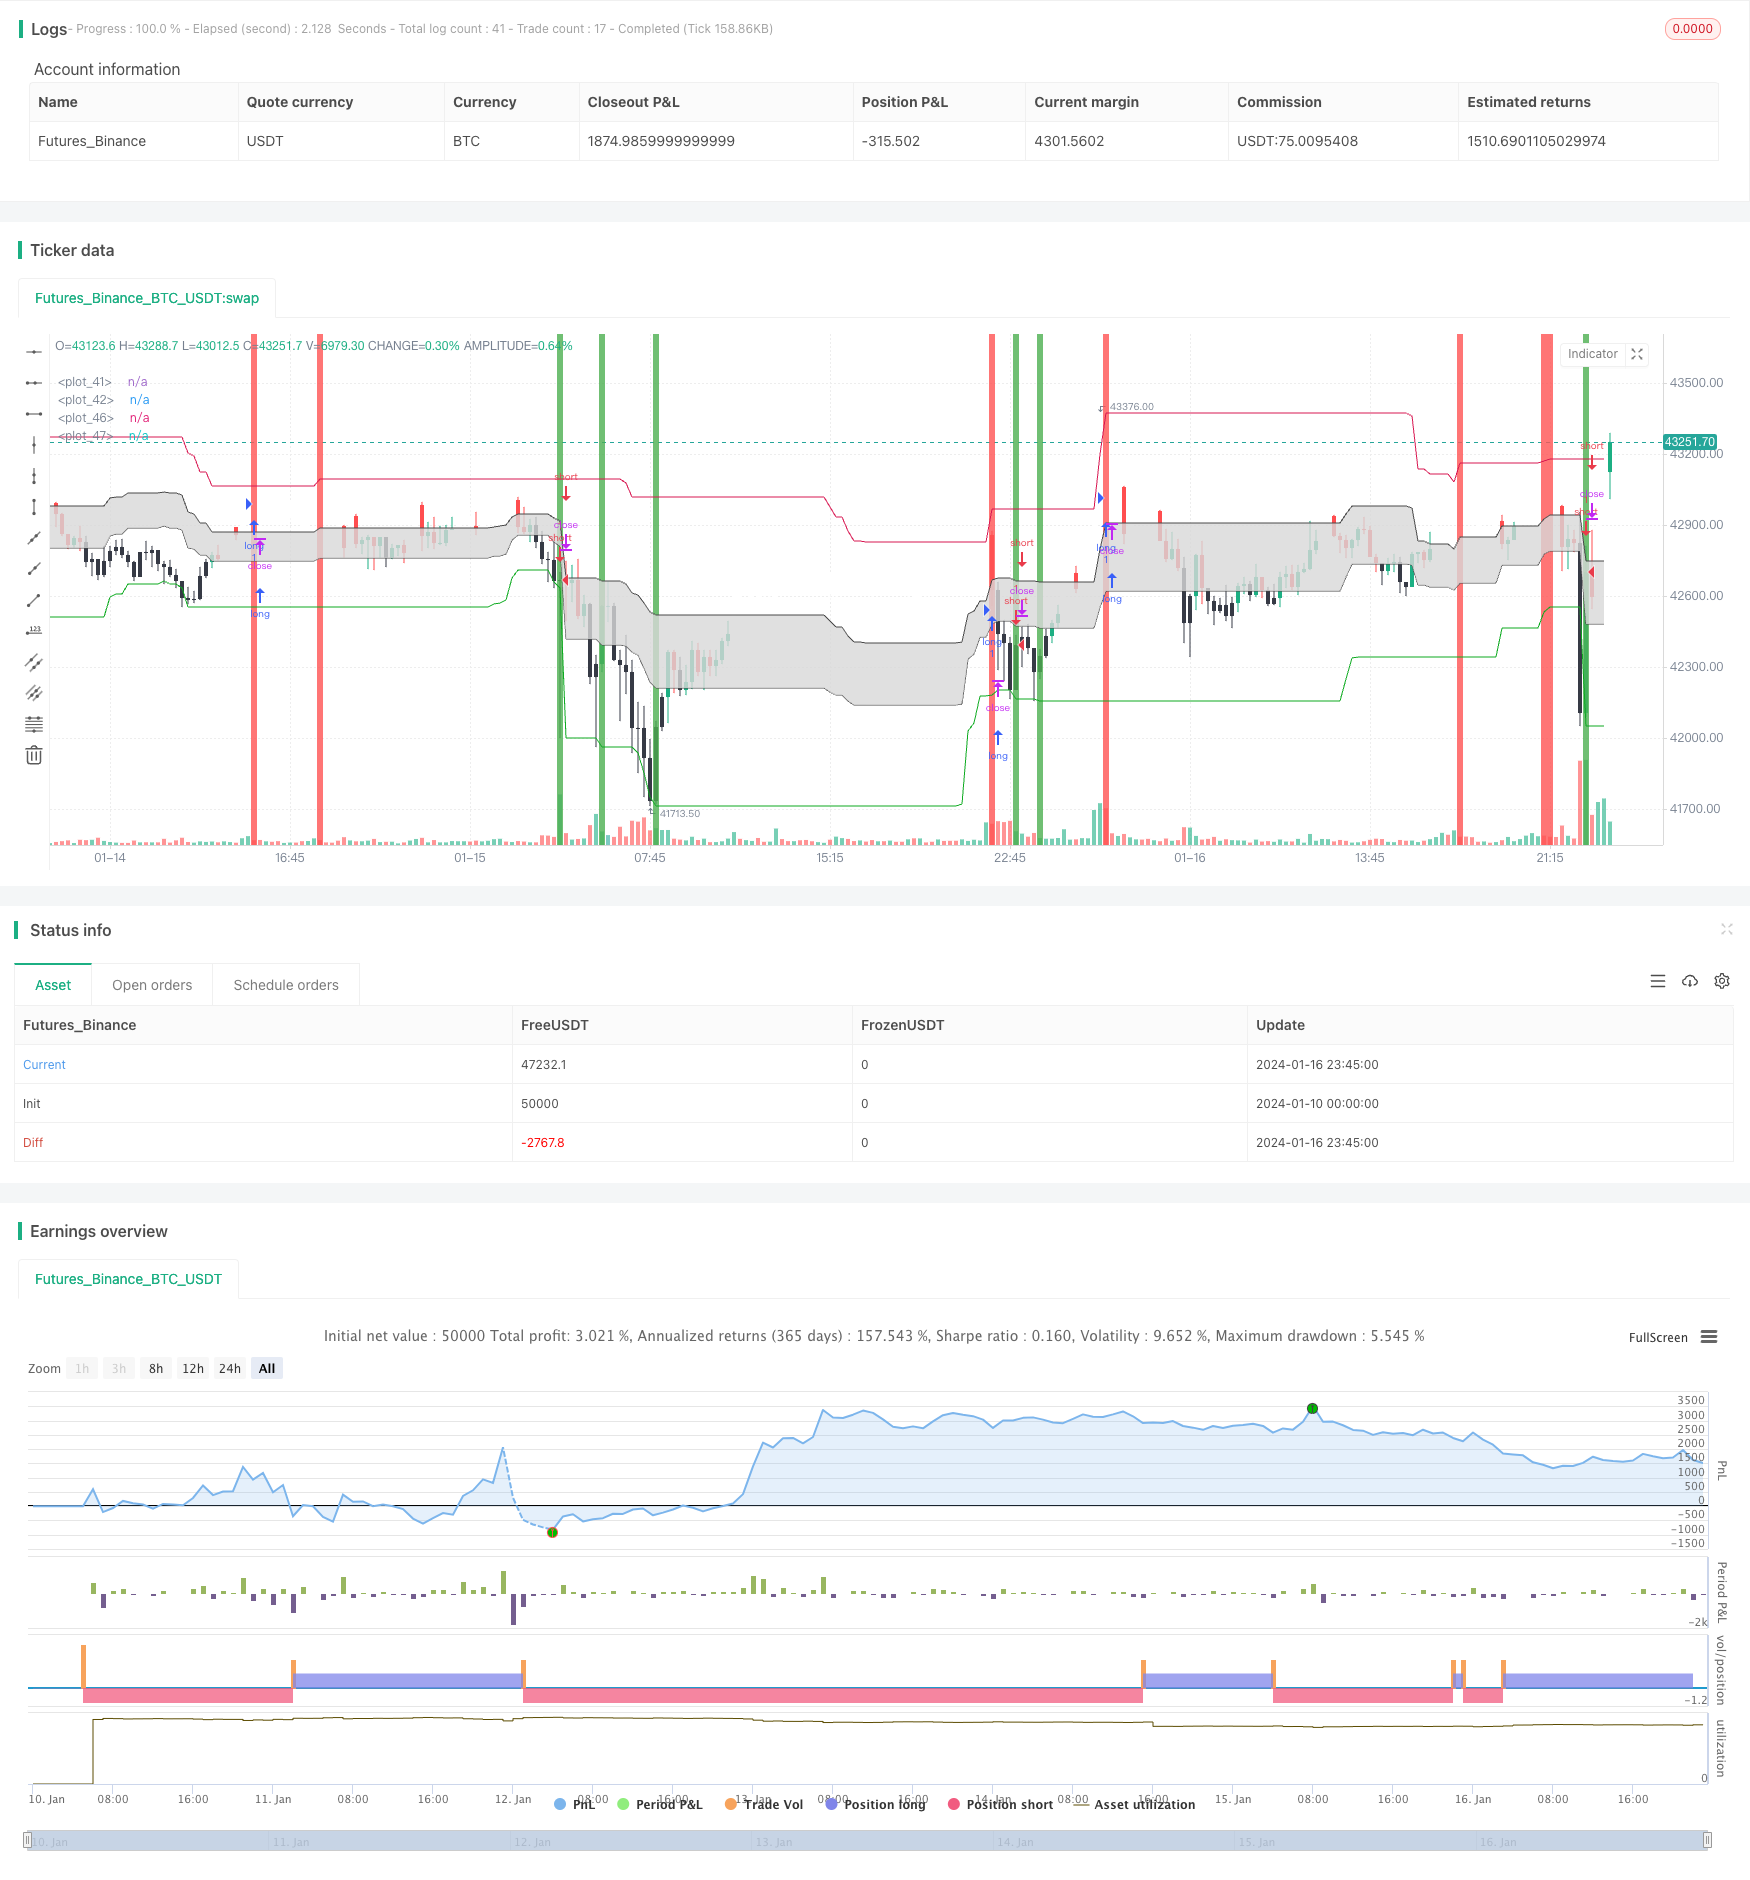
This indicator aims to identify key support and resistance levels in the market and draw support and resistance clouds on the chart to represent the areas between these points. The indicator combines statistical analysis and graphical display to assist traders in determining trend reversal points and breakouts. It is a commonly used auxiliary analysis tool.

Principle

The core logic of this indicator is to statistically calculate the highest and lowest prices over a certain period of time to identify potential support and resistance levels. The calculation formulas are as follows:

  1. Statistically calculate the highest price periodHigh and the lowest price periodLow over the input cycle
  2. Calculate the mid-price of the period periodCenter = (periodHigh+periodLow)/2
  3. Calculate the 0.382 retracement period0382 = periodLow + (periodHigh-periodLow)*0.382
  4. Calculate the 0.618 retracement period0618 = periodLow + (periodHigh-periodLow)*0.618

The above four lines constitute the key points of the support/resistance cloud of this indicator. The indicator uses filled colors to fill cloud shapes between the 0.382 line and the 0.618 line, visually displaying the fluctuation range and key price levels.

When the closing price is above the 0.618 line, the bar color is white, and conversely when it is below the 0.382 line, the bar color is black, which belongs to sell and buy signals. The support/resistance cloud displayed by this indicator can be seen as the range of potential support/resistance levels. Prices breaking through these upper and lower boundaries usually mean a trend reversal.

Advantage Analysis

This support/resistance cloud indicator has the following outstanding advantages:

  1. Intuitively displays key support/resistance levels and price fluctuation ranges to assist in judging trends and reversal points
  2. Filled shapes emphasize visual effects for clarity
  3. Simple parameter settings, easy to master and adjust
  4. Can be combined with other indicators to improve efficacy
  5. Applicable to multi-cycle analysis

Risk Analysis

It should be noted that this indicator also has some inherent deficiencies and risks:

  1. Smoothed curves may lag price changes
  2. Multi-empty position judgments may be misjudged
  3. Need to be combined with other indicators for diagnosis and judgment to avoid reliance on a single one
  4. Need to pay attention to piercing and envelope dilemmas
  5. Improper parameter settings may affect results

Optimization Directions

This indicator can be further optimized in the following aspects:

  1. Increase adaptive parameter setting functions
  2. Combine more statistical indicators to filter misjudgements
  3. Add audio, message reminder modules
  4. Increase backtesting analysis evaluation modules
  5. Visual parameter tuning modules
  6. Custom indicator portfolio template storage functions

Summary

This support/resistance cloud indicator integrates statistical analysis and graphical display functions. It can effectively assist in determining key support/resistance levels and breakouts. However, it cannot rely solely on itself. It needs to be combined with other multiple indicators to maximize its usefulness. It can be upgraded from adaptive parameter settings, multi-indicator filtering combinations and other dimensions to improve practicality.


/*backtest
start: 2024-01-10 00:00:00
end: 2024-01-17 00:00:00
period: 15m
basePeriod: 5m
exchanges: [{"eid":"Futures_Binance","currency":"BTC_USDT"}]
*/

//@version=3
strategy("[IND] rang3r", overlay=true)
entP = input(50, "Entry Period: ")
exP = input(25, "Exit period: ")
sensitivity = input(0.9999, "Sensitivity")
periodHigh = 0.0
periodLow = 0.0
epH = 0.0
epL = 0.0

    
//Entry Trades
for i = 1 to (entP+1)
    if i == 1 
        periodHigh:=high[i]
    else
        if periodHigh < high[i]
            periodHigh:=high[i]
    

for i = 1 to (entP+1)
    if i == 1 
        periodLow:=low[i]
    else
        if periodLow > low[i]
            periodLow:=low[i]
                
s = high[1] > periodHigh*sensitivity and open > close //and (close[1] > open[1] ? open[1] : close[1]) > close
l = low[1] < periodLow*(1/sensitivity) and close > open //and (close[1] > open[1] ? close[1] : open[1]) < close

strategy.entry("long", strategy.long, when=s)
strategy.entry("short", strategy.short, when=l)

bgcolor(l ? green : na)
bgcolor(s ? red : na)

periodCenter = (periodHigh+periodLow)/2
period0618 = (periodLow)+(periodHigh-periodLow)*0.618
period0382 = (periodLow)+(periodHigh-periodLow)*0.382

cloud1 = plot(period0382, color=#494949)
cloud2 = plot(period0618, color=#494949)

fill(cloud1, cloud2, color=#d8d8d8)

plot(periodHigh, color=#d81751)
plot(periodLow, color=#0daa20)
//plot(periodCenter, color=#494949)

bc = close > period0618 ? white : (close < period0382 ? black : na)

barcolor(bc)
template: strategy.tpl:40:21: executing "strategy.tpl" at <.api.GetStrategyListByName>: wrong number of args for GetStrategyListByName: want 7 got 6