概述
本策略名为“基于RSI和WMA的趋势追踪策略”。该策略综合利用了相对强弱指标(RSI)和加权移动平均线(WMA)两个指标的优势,通过RSI指标判断超买超卖区域,结合WMA指标判断价格趋势方向,实现对价格趋势的有效追踪。
策略原理
该策略主要利用RSI指标判断股票超买超卖的情况。当RSI指标低于超卖线时,认为股票处于超卖状态, diesem lange Positionenをöffnen können。当RSI指标高于超买线时,认为股票处于超买状态,这时可以miden lange Positionenがopened wurde, es ist eine gute Opportunity zu schließen。 此外,该策略还使用WMA指标衡量价格趋势。当价格上穿WMA均线时,表明价格开始上涨;当价格下穿WMA均线时,表明价格开始下跌。通过RSI判断超买超卖同时结合WMA判断价格趋势,可以有效地跟踪价格趋势,在相对低点买入,相对高点卖出。
具体来说,该策略的交易逻辑是:
1. 当RSI指标低于超卖线时,做多并设置止盈单。
2. 当RSI指标高于超买线且有做多头寸时,平掉做多头寸。
3. 当价格上穿WMA均线时,撤销之前设定的做多止盈单。
4. 当价格下穿WMA均线且有做多头寸时,平掉做多头寸。
通过这种交易逻辑,可以在相对低点追踪做多趋势,在相对高点追踪做空趋势,有效获取价格趋势中的部分利润。
策略优势
该策略主要有以下几个优势:
- 同时利用RSI和WMA两个指标,可以更准确判断价格趋势和超买超卖区域。
- 通过追踪超买超卖区域进入场内,可以在相对高低点进入。
- 采用止盈单设置方式,可以在趋势反转时快速退出,获取部分利润。
- 策略逻辑简单清晰,容易理解和调整参数。
- 可同时做多做空,适用于任何市场环境。
策略风险
该策略也存在一些风险,主要有:
- RSI和WMA指标均有时间滞后问题,可能识别超买超卖区域和价格趋势反转存在一定滞后。
- 止盈单容易被冲击,无法完全退出。
- 策略参数需要不断优化和调整,如超买超卖线、均线周期等。
- 大幅度行情震荡会给策略造成较大亏损。
针对这些风险,可以通过设置止损,调整参数优化等方式进行改进和优化。
策略优化方向
该策略还需要在以下几个方面进行进一步优化:
- 增加止损单功能。因为运行中的止盈单可能被迅速冲销,应同时设置止损单。
- 优化RSI和WMA的参数。可以通过回测和模拟实盘来测试不同的参数对策略收益率的影响。
- 增加仓位管理功能。通过仓位比例、再投入次数等方式控制单个头寸的风险敞口。
- 结合更多指标进行判断。除RSI和WMA外,还可以引入MACD、KD等其它指标,形成指标组合策略。
- 增加机器学习算法,利用算法自动优化参数。achine learning algorithms can optimize the parameters automatically based on backtesting.
总结
本策略综合运用RSI和WMA两个指标,在判断超买超卖的同时识别价格趋势反转,实现自动追踪价格趋势,获取部分利润。策略优化空间还很大,通过引入更多特征、控制仓位管理、运用机器学习等方式可以进一步提高策略收益率和稳定性。总体来说,该策略为一种较为简单直接的趋势追踪策略。
/*backtest
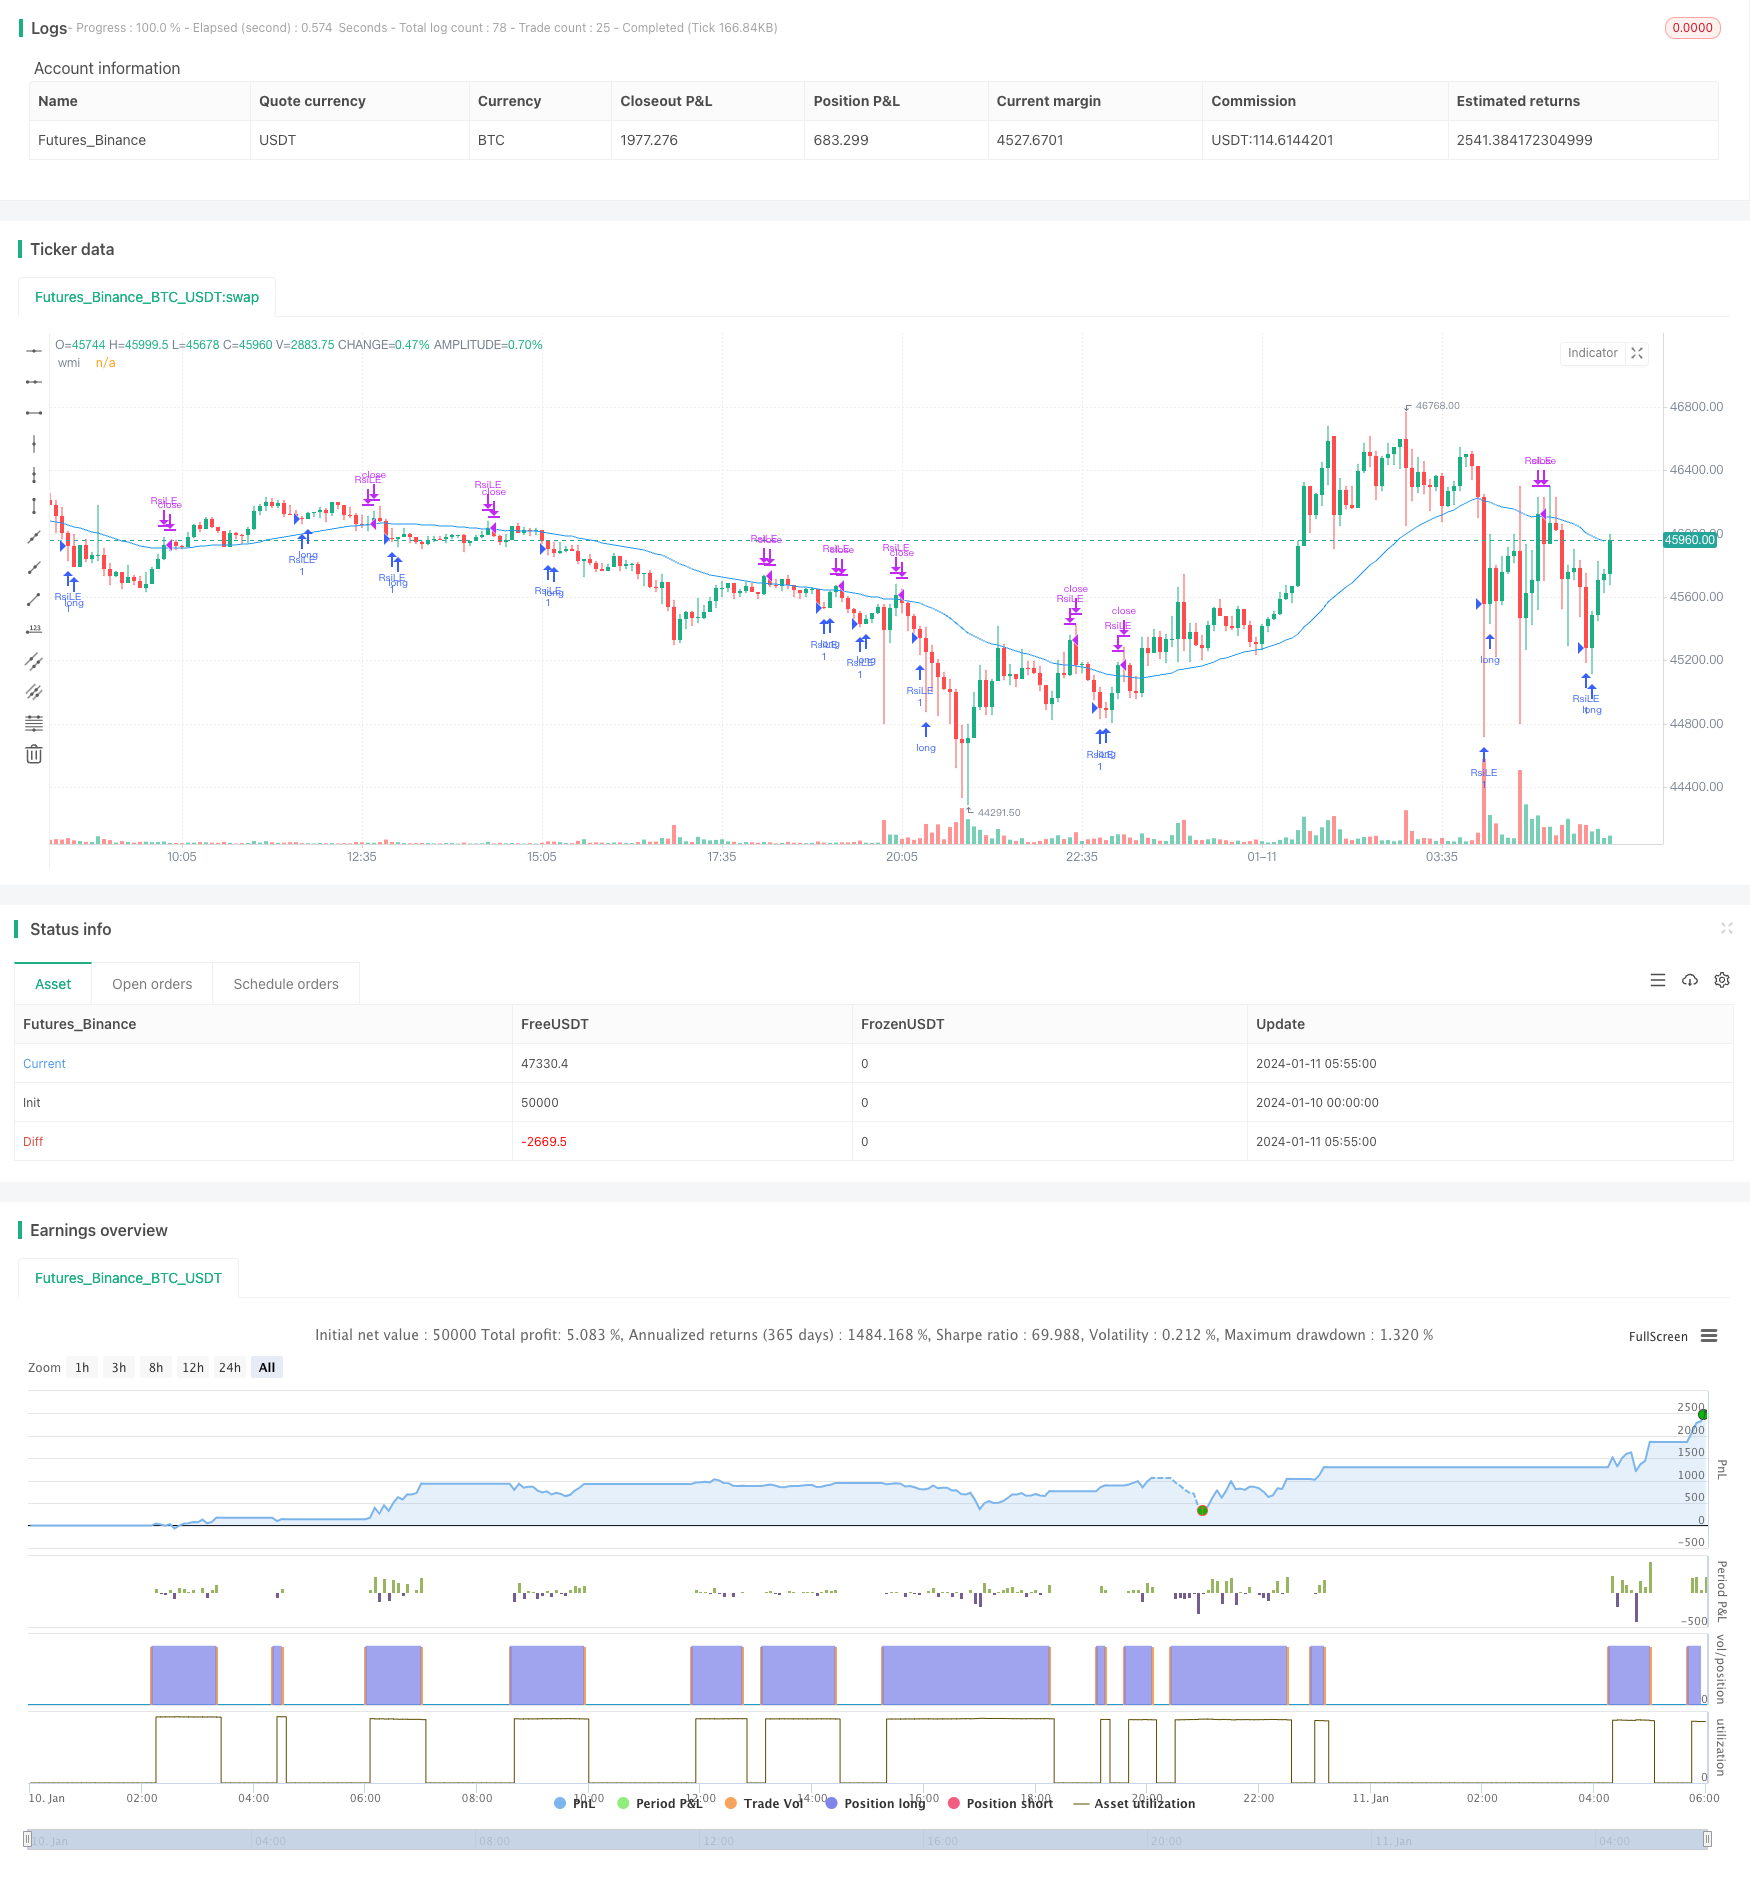
start: 2024-01-10 00:00:00
end: 2024-01-11 06:00:00
period: 5m
basePeriod: 1m
exchanges: [{"eid":"Futures_Binance","currency":"BTC_USDT"}]
*/
//@version=5
//Lets connect on LinkedIn (https://www.linkedin.com/in/lets-grow-with-quality/)
//
//I use my indicator it in real life with a zero commision broker ob S&P500 Daily.
//Best performace when used with S&, lomg only and pyramiding on daily timeframe.
//
//Please.. still use your brain for entries and exits: higher timeframes, market structure, trend ...
//If you obviously can see, like when corona started, that cubic tons of selling volume is going to punsh the markets, wait until selling climax is over and so on..
strategy("RSI/WMA Strategy", overlay=true)
length = input(2)
overSold = input(10)
overBought = input(90)
wmaLength = input(50, title="WMA Length")
enableLongTrades = input(true, title="Enable Long Trades")
longExit = input(true, title="Enable Long Exit")
enableShortTrades = input(false, title="Enable Short Trades")
shortExit = input(false, title="Enable Short TradExites")
price = close
vrsi = ta.wma(ta.rsi(price, length), 2)
wma = ta.wma(price, wmaLength)
co = ta.crossunder(vrsi, overSold)
cu = ta.crossunder(vrsi, overBought)
if (not na(vrsi))
if (enableLongTrades and co)
strategy.entry("RsiLE", strategy.long, comment="RsiLE")
if (enableShortTrades and cu)
strategy.entry("RsiSE", strategy.short, comment="RsiSE")
// Close long position if price crosses above SMA
if (longExit and ta.crossover(price, wma))
strategy.close("RsiLE", comment="Close Long")
// Close short position if price crosses below SMA
if (shortExit and ta.crossunder(price, wma))
strategy.close("RsiSE", comment="Close Short")
// Plot für visuelle Überprüfung
plot(wma, title="wmi", color=color.blue)