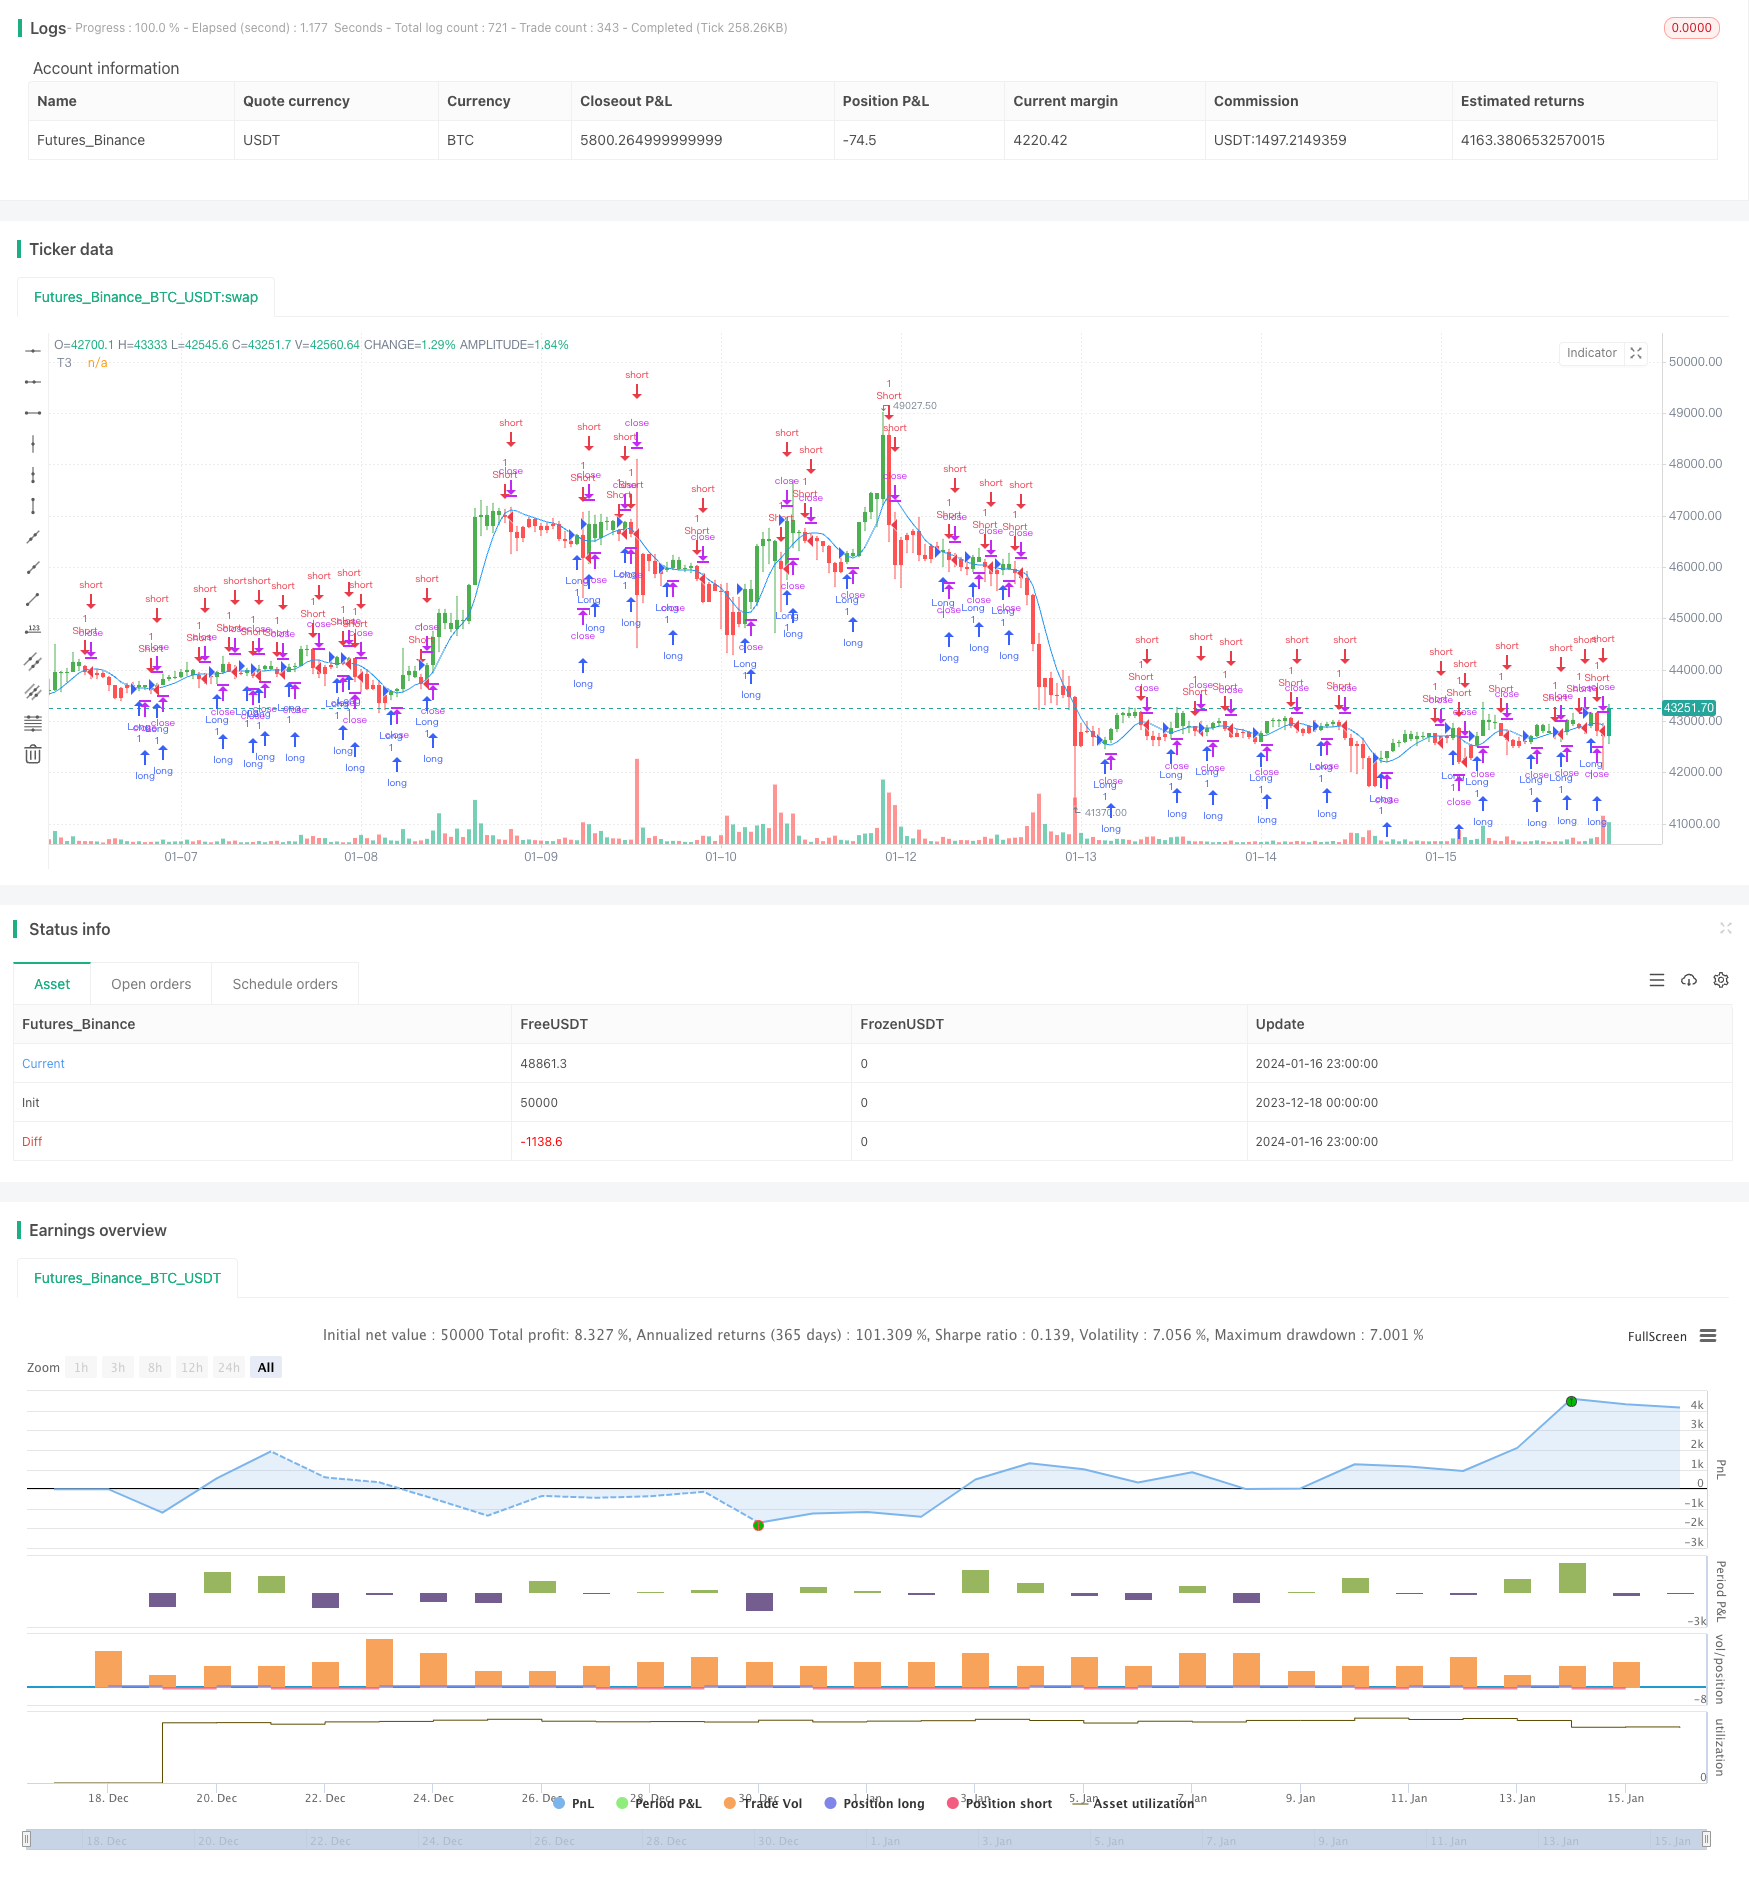
策略概述
该策略基于T3移动平均线指标设计了一个趋势追踪交易系统。该系统可以自动识别价格趋势方向,并相应做多做空。当价格上扬时做多,当价格下跌时做空。该系统还具有反转交易的功能。
策略原理
该策略使用T3指标判断价格趋势方向。T3指标是一个自适应移动平均线,它具有更高的灵敏度,可以更快速地响应价格变化。该指标的计算公式为:
T3(n) = GD(GD(GD(n)))
其中,GD代表广义DEMA(双指数移动平均线),计算公式为:
GD(n,v) = EMA(n) * (1+v)-EMA(EMA(n)) * v
v是体量因子,决定了移动平均线对价格线性趋势的响应灵敏度。当v=0时,GD=EMA;当v=1时,GD=DEMA。作者建议设置v=0.7。
该策略将T3指标与价格进行对比,当T3上穿价格时判断为价格上涨趋势,做多;当T3下穿价格时判断为价格下跌趋势,做空。
策略优势
- 使用自适应移动平均线T3指标,对价格趋势变化响应灵敏
- 自动判断价格趋势方向,无需手动判断
- 可配置反转交易,灵活应对市场变化
策略风险
- T3指标可能出现盘整震荡时难以判断趋势方向的情况
- 自适应移动平均线指标容易产生误差信号
- 反转交易时的风险控制需要谨慎
可以通过调整T3指标的参数,或者增加其他指标过滤来减少误交易。也可以设置止损来控制单次损失。
策略优化方向
- 增加其他指标滤波,例如MACD、RSI等指标进行组合
- 增加趋势判断规则,避免震荡市时的误操作
- 优化参数,调整v的值获得更佳的参数组合
- 加入止损逻辑
总结
该策略通过T3指标自动判断价格趋势方向,无需人工判断,可以自动做多做空。同时可配置反转交易逻辑,应对更加复杂的市场情况。指标参数、交易逻辑等都有优化空间,可以使策略表现更加出色。
策略源码
/*backtest
start: 2023-12-18 00:00:00
end: 2024-01-17 00:00:00
period: 1h
basePeriod: 15m
exchanges: [{"eid":"Futures_Binance","currency":"BTC_USDT"}]
*/

//@version=2
////////////////////////////////////////////////////////////
//  Copyright by HPotter v1.00 29/11/2017
// This indicator plots the moving average described in the January, 1998 issue
// of S&C, p.57, "Smoothing Techniques for More Accurate Signals", by Tim Tillson.
// This indicator plots T3 moving average presented in Figure 4 in the article.
// T3 indicator is a moving average which is calculated according to formula:
//     T3(n) = GD(GD(GD(n))),
// where GD - generalized DEMA (Double EMA) and calculating according to this:
//     GD(n,v) = EMA(n) * (1+v)-EMA(EMA(n)) * v,
// where "v" is volume factor, which determines how hot the moving average’s response
// to linear trends will be. The author advises to use v=0.7.
// When v = 0, GD = EMA, and when v = 1, GD = DEMA. In between, GD is a less aggressive
// version of DEMA. By using a value for v less than1, trader cure the multiple DEMA
// overshoot problem but at the cost of accepting some additional phase delay.
// In filter theory terminology, T3 is a six-pole nonlinear Kalman filter. Kalman
// filters are ones that use the error — in this case, (time series - EMA(n)) —
// to correct themselves. In the realm of technical analysis, these are called adaptive
// moving averages; they track the time series more aggres-sively when it is making large
// moves. Tim Tillson is a software project manager at Hewlett-Packard, with degrees in
// mathematics and computer science. He has privately traded options and equities for 15 years.
//
// You can change long to short in the Input Settings
// WARNING:
// - For purpose educate only
// - This script to change bars colors.
////////////////////////////////////////////////////////////
strategy(title="T3 Averages", shorttitle="T3", overlay = true)
Length = input(5, minval=1)
b = input(0.7, minval=0.01,step=0.01)
reverse = input(false, title="Trade reverse")
xPrice = close
xe1 = ema(xPrice, Length)
xe2 = ema(xe1, Length)
xe3 = ema(xe2, Length)
xe4 = ema(xe3, Length)
xe5 = ema(xe4, Length)
xe6 = ema(xe5, Length)
c1 = -b*b*b
c2 = 3*b*b+3*b*b*b
c3 = -6*b*b-3*b-3*b*b*b
c4 = 1+3*b+b*b*b+3*b*b
nT3Average = c1 * xe6 + c2 * xe5 + c3 * xe4 + c4 * xe3
pos = iff(nT3Average > close, -1,
       iff(nT3Average < close, 1, nz(pos[1], 0)))
possig = iff(reverse and pos == 1, -1,
          iff(reverse and pos == -1, 1, pos))
if (possig == 1)
    strategy.entry("Long", strategy.long)
if (possig == -1)
    strategy.entry("Short", strategy.short)
barcolor(possig == -1 ? red: possig == 1 ? green : blue )
plot(nT3Average, color=blue, title="T3")