概述
动量加速扩展价量趋势(Extended Price Volume Trend, EPVT)策略是一种技术指标组合策略。它结合了动量加速指标与其他辅助指标,识别潜在的趋势反转点和动量转变时机。
策略原理
该策略的核心指标是扩展价量趋势(EPVT)。它的计算方法是:累积交易量 * 价格涨跌幅。然后计算一定周期内 EPVT 的最大值与最小值,得到基准区。EPVT 指标曲线即为 EPVT 与该基准区的差值曲线。
当 EPVT 指标曲线向上穿越零轴时,表示买入压力增强,做多信号出现。反之 EPVT 向下穿越零轴时,做空信号出现。
为提高信号质量,策略还辅助使用简单移动平均线,确认趋势转变的可靠性。
优势分析
该策略结合了趋势、动量和交易量三个维度的指标,能较全面判断市场买卖意愿和力度。使用扩展价量趋势指标,对短期内突发的超量行情有很好的识别作用,可抓住市场的转折点。
设置三档止盈位置离场,可根据自己的风险偏好选择不同的止盈比例。
风险分析
该策略较依赖指标曲线的形态特征,当走势不典型时会发出错误信号。此外,three bars反转等情况也会导致不必要的反向开仓。
可适当调整参数,或增加其他滤波指标来优化。止损策略也可降低单次损失。
优化方向
参数优化。如调整 EPVT 周期参数,寻找最佳参数组合。
增加趋势过滤条件。如在 EPVT 信号基础上,判断价格通道或均线的方向。
优化止损策略。如设置固定数值止损或ATR 止损。
总结
动量加速扩展价量趋势策略,通过 EPVT 指标发掘市场买卖意愿的变化,藉此抓住潜在的趋势转折点。设置三档不同比例的止盈出场,可满足投资者不同的风险偏好。该策略值得进一步测试与优化,可成为识别市场短期走势转变的有效工具。
策略源码
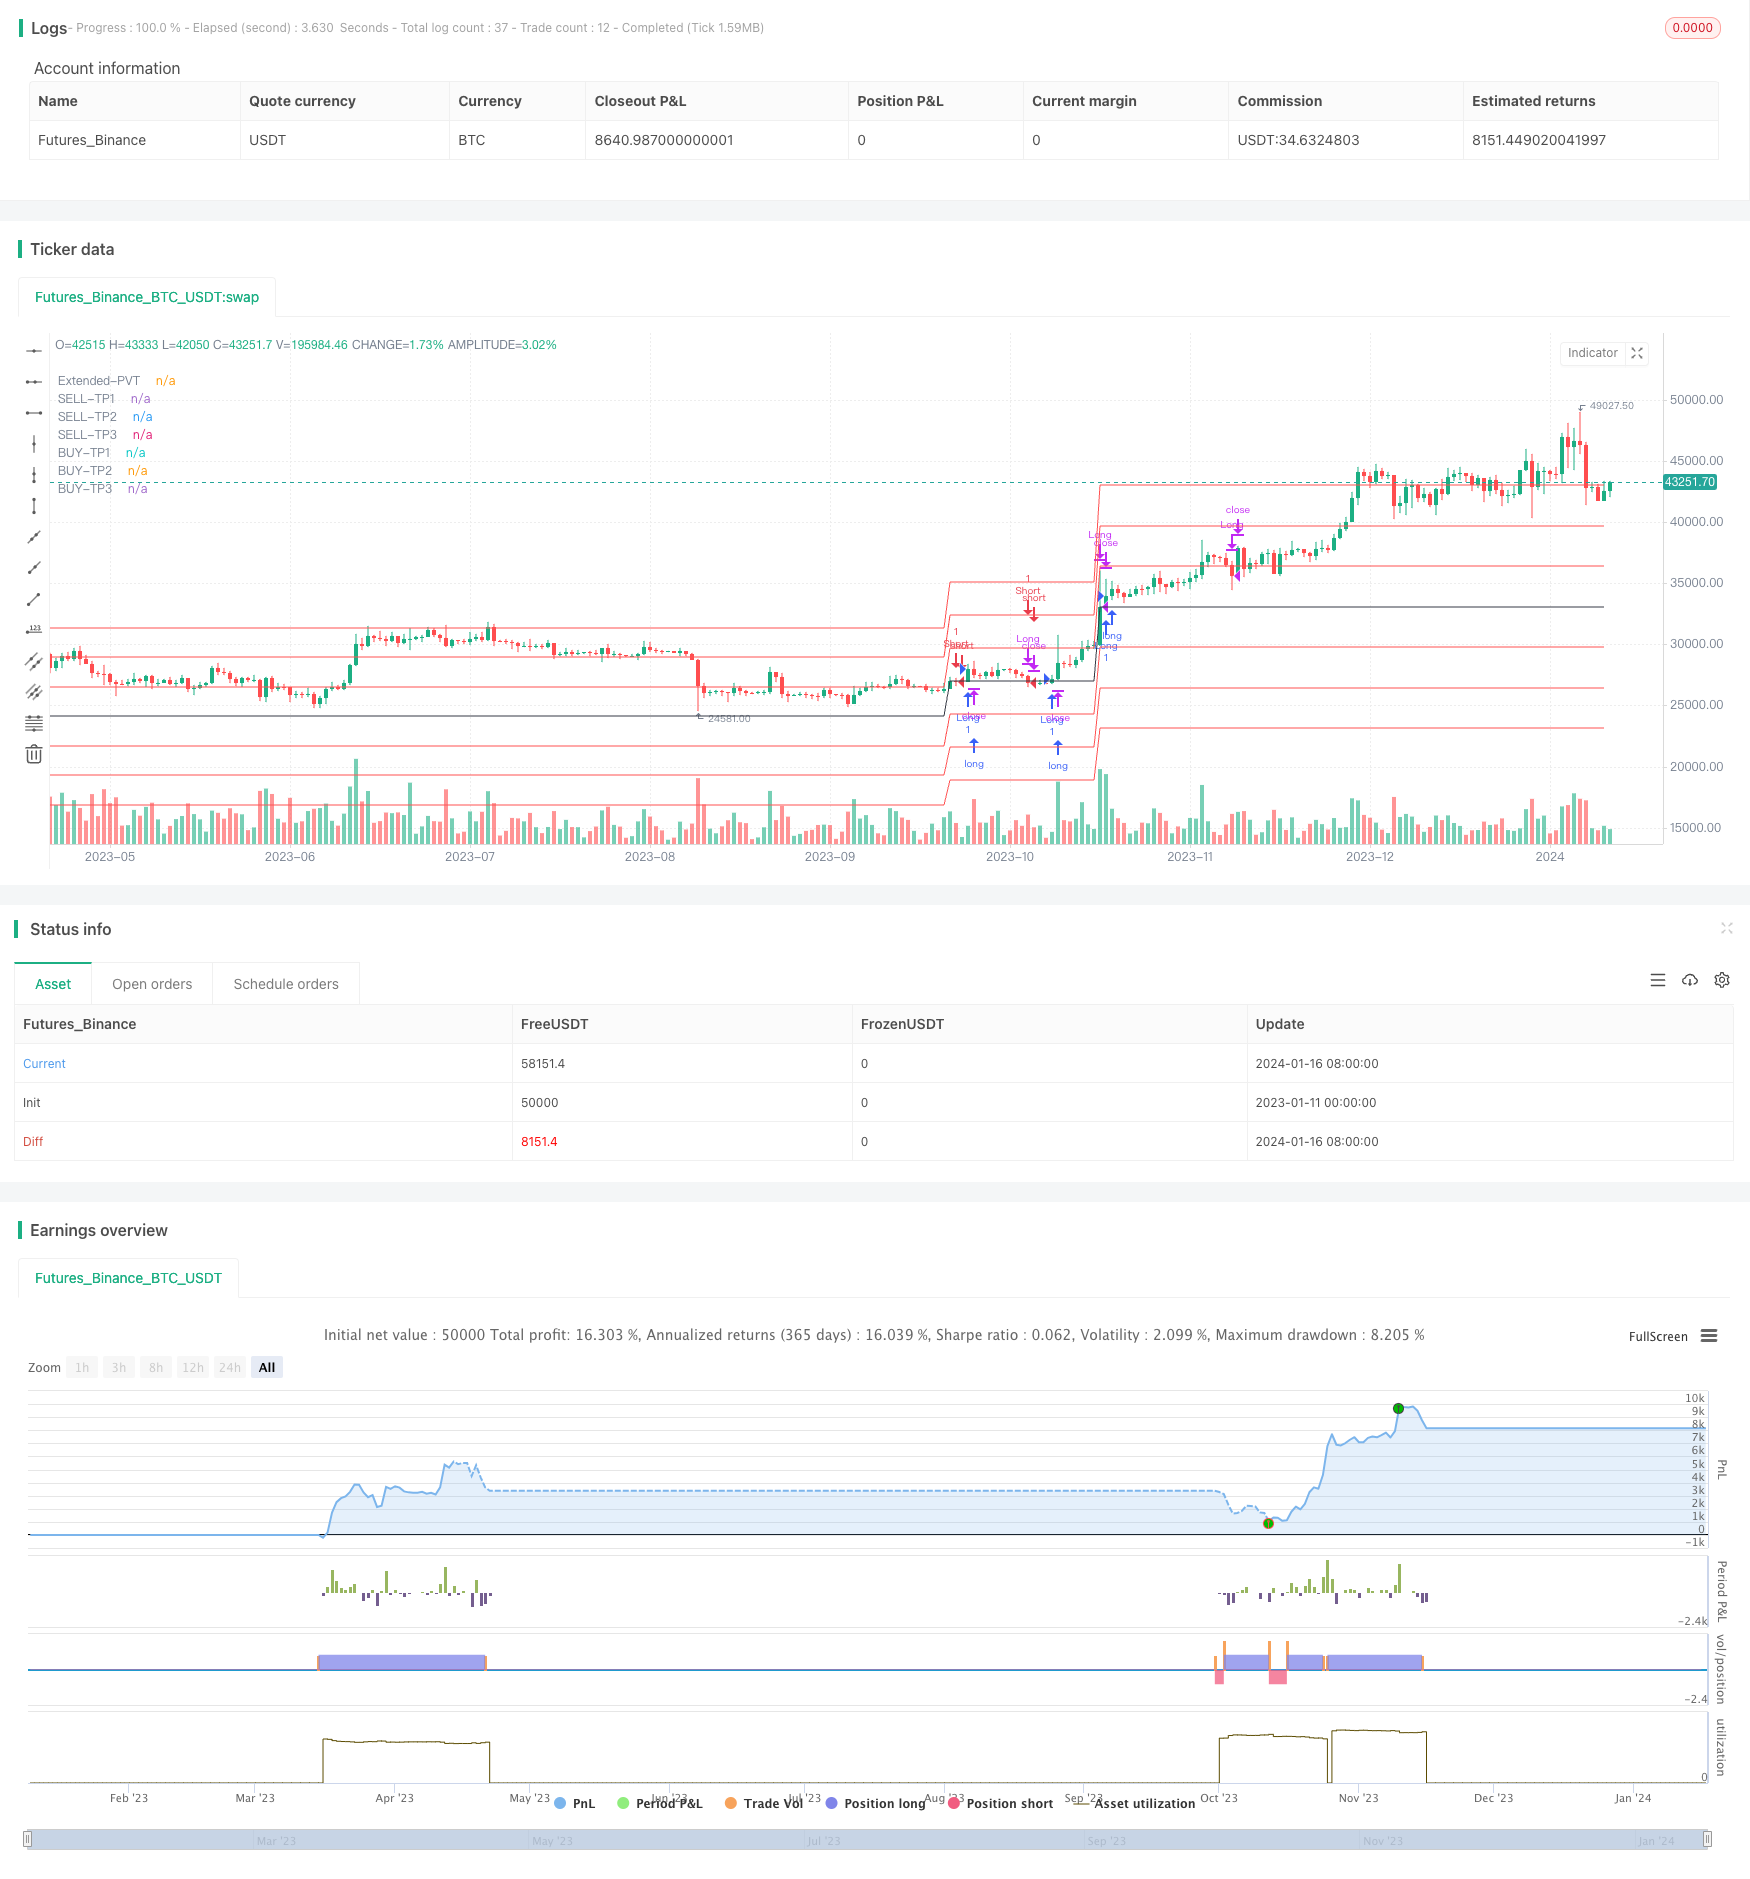
/*backtest
start: 2023-01-11 00:00:00
end: 2024-01-17 00:00:00
period: 1d
basePeriod: 1h
exchanges: [{"eid":"Futures_Binance","currency":"BTC_USDT"}]
*/

//@version=5
strategy(title="Extended Price Volume Trend", overlay=true )//@version=5
var cumVol = 0.
cumVol += nz(volume)
if barstate.islast and cumVol == 0
    runtime.error("No volume is provided by the data vendor.")
src = close
lenght = input(200,"Trend Lenght")
vt = ta.cum(ta.change(src)/src[1]*volume)
upx = ta.highest(vt,lenght)
downx = ta.lowest(vt,lenght)
basex = (upx +downx)/2
VTX = vt - basex
VTY = ta.valuewhen(ta.cross(VTX,0),close,0)
plot(VTY, color=color.black, title="Extended-PVT")

/////////////////////// STRATEGY ////////////////
/////////////////////// TAKE PROFIT SECTION ////////////////
longConditionx = ta.crossover(close,VTY)
ShortConditionx = ta.crossunder(close,VTY)
tp1 = input.int(10, minval=1,title = "TP-1")
tp2 = input.int(20, minval=1,title = "TP-2")
tp3 = input.int(30, minval=1,title = "TP-3")

ematp = ta.ema(close,2)
TPTAKA1S = VTY*(1-tp1/100)
plot(TPTAKA1S, "SELL-TP1", color=color.red,linewidth = 1)
TPTAKA2S = VTY*(1-tp2/100)
plot(TPTAKA2S, "SELL-TP2", color=color.red,linewidth = 1)
TPTAKA3S = VTY*(1-tp3/100)
plot(TPTAKA3S, "SELL-TP3", color=color.red,linewidth = 1)

TPTAKA1B = VTY*(1+tp1/100)
plot(TPTAKA1B, "BUY-TP1", color=color.red,linewidth = 1)
TPTAKA2B = VTY*(1+tp2/100)
plot(TPTAKA2B, "BUY-TP2", color=color.red,linewidth = 1)
TPTAKA3B = VTY*(1+tp3/100)
plot(TPTAKA3B, "BUY-TP3", color=color.red,linewidth = 1)

BUYTP = ta.crossunder(close,VTY) or ta.crossunder(ematp,TPTAKA1B) or ta.crossunder(ematp,TPTAKA2B) or ta.crossunder(ematp,TPTAKA3B)
SELLTP = ta.crossover(close,VTY) or ta.crossover(ematp,TPTAKA1S) or ta.crossover(ematp,TPTAKA2S) or ta.crossover(ematp,TPTAKA3S)
/////////////////////// STRATEGY ////////////////
// Check for Long Entry
longCondition = longConditionx==true
if longCondition
    strategy.entry('Long', strategy.long, comment = "ENTER-LONG")

buyclose = ShortConditionx==true or BUYTP==true
// Exit condition
strategy.close('Long', when=buyclose or BUYTP==true, comment = "EXIT-LONG")

// Check for Short Entry
ShortCondition = ShortConditionx==true
if ShortCondition
    strategy.entry('Short', strategy.short, comment = "ENTER-SHORT")

sellclose = longConditionx==true or SELLTP ==true
// Exit condition
strategy.close('Short', when=sellclose or SELLTP==true, comment = "EXIT-SHORT")
///// END OF STRATEGY ///////////