概述
该策略是一个基于高斯误差函数来计算价格变化的P-Signal指标的量化交易策略。它使用P-Signal指标判断价格趋势和转折点,以此来决定入场和退出的时机。
策略原理
该策略的核心指标是P-Signal。P-Signal的计算公式如下:
fPSignal(ser, int) =>
    nStDev = stdev(ser, int)
    nSma = sma(ser, int)
    fErf(nStDev > 0 ? nSma/nStDev/sqrt(2) : 1.0)
这里ser代表价格序列,int代表参数nPoints,也就是看多少根K线。该公式由三部分组成:
- nStDev是价格的标准差;
- nSma是价格的简单移动平均;
- fErf是高斯误差函数。
整个公式的意思是,用价格的移动平均除以价格的标准差,再除以sqrt(2)做标准化,然后通过高斯误差函数映射到(-1, 1)区间。也就是如果价格波动大于平均值,P-Signal接近1;如果价格波动小于平均值,P-Signal接近-1。
策略使用P-Signal的数值和其变化的符号来决定入场和退出:
strategy.entry("long", strategy.long, 1, when = nPSignal < 0 and ndPSignal > 0)

strategy.close("long", when = nPSignal > 0 and ndPSignal < 0)
当P-Signal小于0且变化为正的时候做多;当P-Signal大于0且变化为负的时候平仓。
策略优势
该策略具有以下优势:
- 使用高斯误差函数拟合价格分布。高斯误差函数能很好地拟合正常分布,这与大多数金融时间序列分布特征相符。
- 利用价格的标准差自动调整参数。这使得策略参数范围更广,对市场变化更加鲁棒。
- P-Signal指标结合趋势和反转Trade的优点。它既考虑价格波动趋势,也关注价格反转点,这对捕捉趋势交易和反转交易机会都有帮助。
风险分析
该策略也存在一些风险,主要体现在:
- 高频交易风险。该策略是典型的高频交易策略,会产生较多交易,承担更高的交易成本和滑点风险。
- 震荡行情下表现不佳。P-Signal指标在价格没有明显趋势和规律的市场中,会产生大量虚假信号。
- 参数优化有难度。公式中多个参数之间关系复杂,使参数优化比较困难。
为降低这些风险,可以考虑增加过滤条件,减少交易频率;优化参数组合和交易成本设定;实盘磨合,选择合适品种。
优化方向
该策略还有进一步优化的空间,主要方向有:
- 增加过滤条件,避免虚假信号。例如结合其他指标,做AND或OR条件,过滤掉一部分Noise。
- 优化参数组合。在不同品种和周期调整nPoints的大小,改进策略稳定性。
- 考虑动态参数。让nPoints参数根据市场波动程度做自适应调整,这可能改善策略鲁棒性。
- 结合机器学习方法。使用AI算法对参数、过滤条件以及多品种择时进行优化。
总结
整体来说,该策略核心思路新颖,利用高斯函数拟合价格分布,自动调整参数范畴。但作为一个高频交易策略,还需要进一步的测试和优化,特别是风险控制和参数调整方面,才能在实盘中稳定盈利。
策略源码
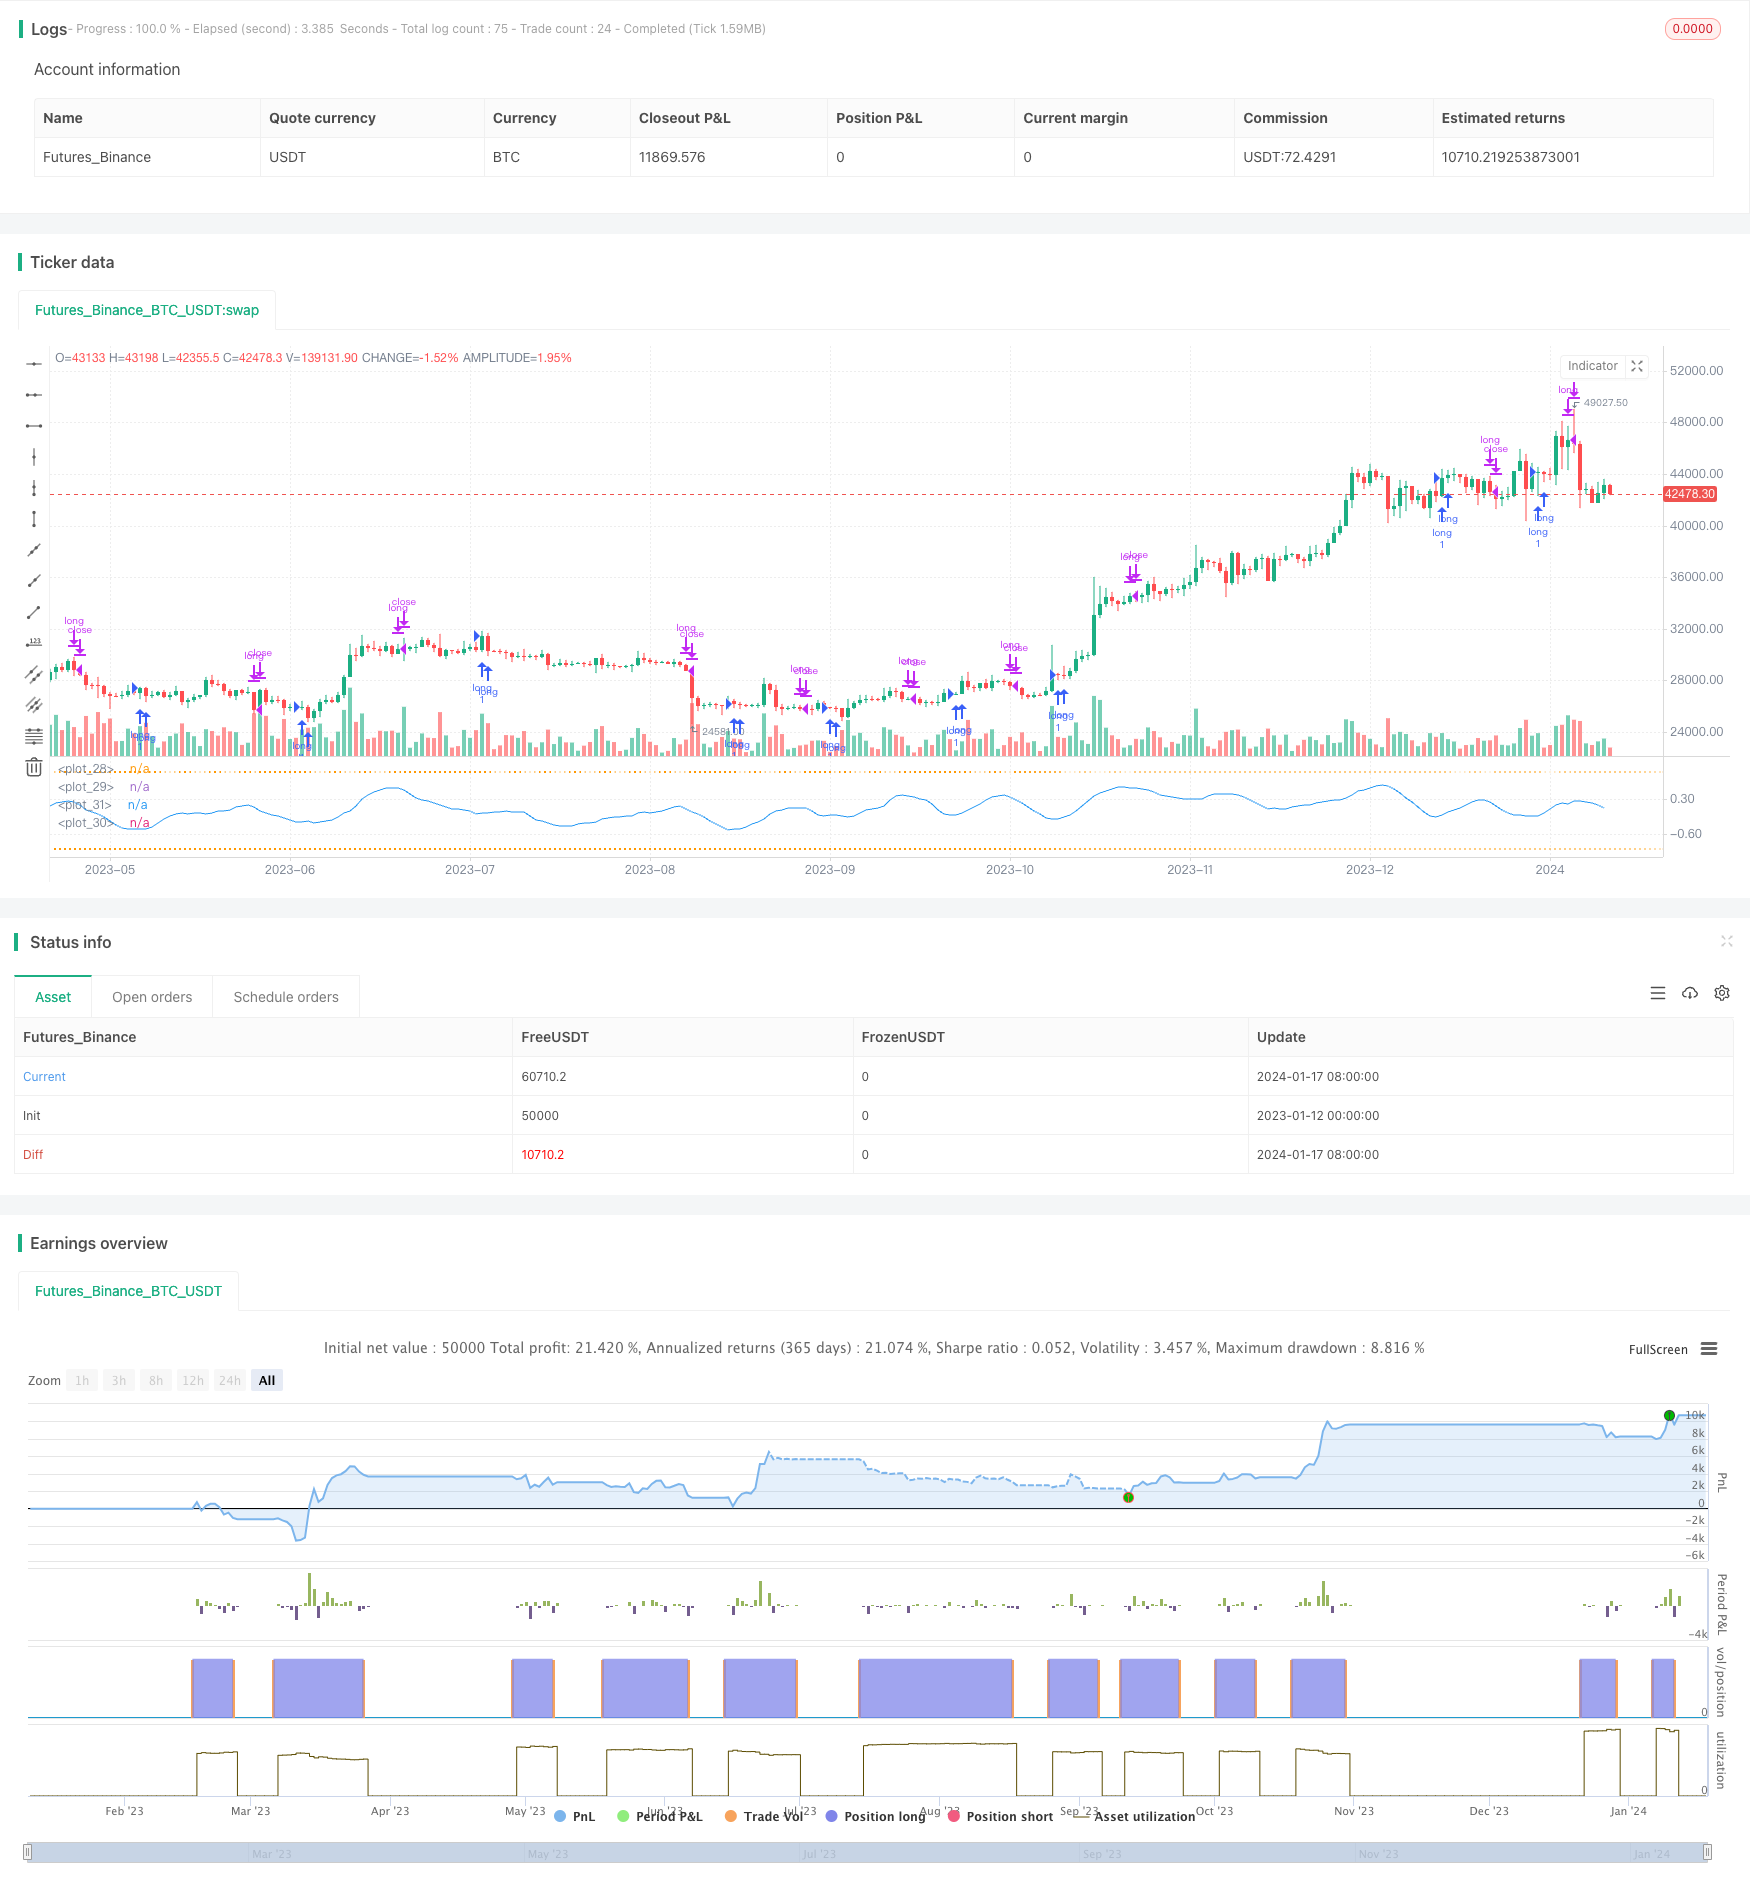
/*backtest
start: 2023-01-12 00:00:00
end: 2024-01-18 00:00:00
period: 1d
basePeriod: 1h
exchanges: [{"eid":"Futures_Binance","currency":"BTC_USDT"}]
*/

// **********************************************************************************************************
// This source code is subject to the terms of the Mozilla Public License 2.0 at https://mozilla.org/MPL/2.0/
// P-Signal Strategy © Kharevsky
// @version=4
// **********************************************************************************************************
strategy("P-Signal Strategy", precision = 3)
// Parameters and const of P-Signal.
nPoints = input(title = "Number of Bars", type = input.integer, defval = 9, minval = 4, maxval = 100, group = "Parameters of observation.")
int nIntr = nPoints - 1
// Horner's method for the error (Gauss) & P-Signal functions.
fErf(x) =>
    nT = 1.0/(1.0 + 0.5*abs(x))
    nAns = 1.0 - nT*exp(-x*x - 1.26551223 +
     nT*( 1.00002368 + nT*( 0.37409196 + nT*( 0.09678418 +
     nT*(-0.18628806 + nT*( 0.27886807 + nT*(-1.13520398 +
     nT*( 1.48851587 + nT*(-0.82215223 + nT*( 0.17087277 ))))))))))
    x >= 0 ? nAns : -nAns
fPSignal(ser, int) =>
    nStDev = stdev(ser, int)
    nSma = sma(ser, int)
    fErf(nStDev > 0 ? nSma/nStDev/sqrt(2) : 1.0)
// Strat.
float nPSignal = sma(fPSignal(change(ohlc4), nIntr), nIntr)
float ndPSignal = sign(nPSignal[0] - nPSignal[1])
strategy.entry("long", strategy.long, 1, when = nPSignal < 0 and ndPSignal > 0)
strategy.close("long", when = nPSignal > 0 and ndPSignal < 0)
// Plotting.
hline(+1.0, color = color.new(color.orange,70), linestyle = hline.style_dotted)
hline(-1.0, color = color.new(color.orange,70), linestyle = hline.style_dotted)
plot(nPSignal, color = color.blue, style = plot.style_line)
plot(strategy.position_size, color = color.white, style = plot.style_cross)
// Alerts.
if(strategy.position_size[0] > strategy.position_size[1])
    alert("P-Signal strategy opened the long position: " + syminfo.tickerid + " " + timeframe.period, alert.freq_once_per_bar)
if(strategy.position_size[0] < strategy.position_size[1])
    alert("P-Signal strategy closed the long position: " + syminfo.tickerid + " " + timeframe.period, alert.freq_once_per_bar)
// The end.