概述
本策略通过多种不同周期的Aroon,MA,BB,Williams,%R,ADX等多种强力指标的组合,形成多维度的强力开仓指标,在趋势较明显时,能够进行高效的开仓。
策略原理
本策略主要通过以下几种指标的组合实现强力开仓信号:
Aroon指标:计算一定周期内的最高价和最低价,形成一个震荡指标,通过多个周期Length的Aroon指标组合,判断趋势走向。
MA均线:计算短周期和长周期的MA均线交叉,判断趋势转折点。
BB布林带:当价格突破布林带上轨时,为卖出信号。
Williams %R指标:该指标在超买超卖区域形成背离,作为开仓信号。
ADX平均方向运动指数:判断趋势的力度,ADX高于某个位置时产生开仓信号。
以上多个指标,通过不同的周期Length参数,组成一个多维度判断体系,在趋势较明显时,多个指标能够形成强力的开仓信号。
具体来说,买入条件有:
- Aroon_1低于-85时
- MA均线形成金叉时
- Williams %R低于-99时
- ADX高于14时
- Aroon_2高于-39时
当上述5个买入条件中满足3个时,产生强力的买入信号。
卖出条件也是类似,有5个卖出条件,当满足其中3个时,产生卖出信号。
所以,该策略通过多种不同指标的组合,在趋势明显时,能产生高确定性的强力开仓信号。
优势分析
本策略最大的优势在于指标信号的多维度组合,这大大减少了因单一指标造成的错误信号的概率,从而能够在趋势较明显时,产生高质量的开仓信号,这是本策略的最大亮点。
其他优势还有:
通过参数调整,可以适应不同市场的特征
指标参数设置科学合理,参数鲁棒性较高
实现了多时间周期的组合,提高了判断准确率
代码结构清晰,易于理解和二次开发
风险分析
本策略也存在一些风险:
多指标组合虽然可以提高判断质量,但是也增加了策略复杂度,扩大了过优化的风险
参数设置不是百分之百完美,在特定市场下可能会失效
指标组合方式还有优化空间,组合逻辑可以进一步提炼
短期调整机会可能会被错过
对应解决方法:
增加样本回测,检验参数的鲁棒性
调整部分参数,使之能够适应更多市场
优化指标集成方式,提高判断质量
适当缩短部分指标参数,增加对短期调整的捕捉
优化方向
本策略的主要优化方向是指标集成方式的优化,主要包括:
添加更多不同类型的指标,形成指标森林,进一步提高判断准确性
优化指标参数设置,使其能够自动适应市场变化
使用机器学习等方法,自动搜索最优指标集成方案
增加止损策略,以控制风险
结合情绪指标等,判断市场热度,动态调整参数
通过集成更多指标,自动优化参数和集成方案,本策略的判断质量和鲁棒性还有很大提升空间。
总结
本策略最大的亮点是多种指标的科学集成,形成强力的开仓信号,在趋势明显时,效果显著。该策略集成方式还有很多优化空间,通过引入更多指标,以及参数和集成方式的智能优化,本策略可以成为一个非常强大的量化交易策略。
/*backtest
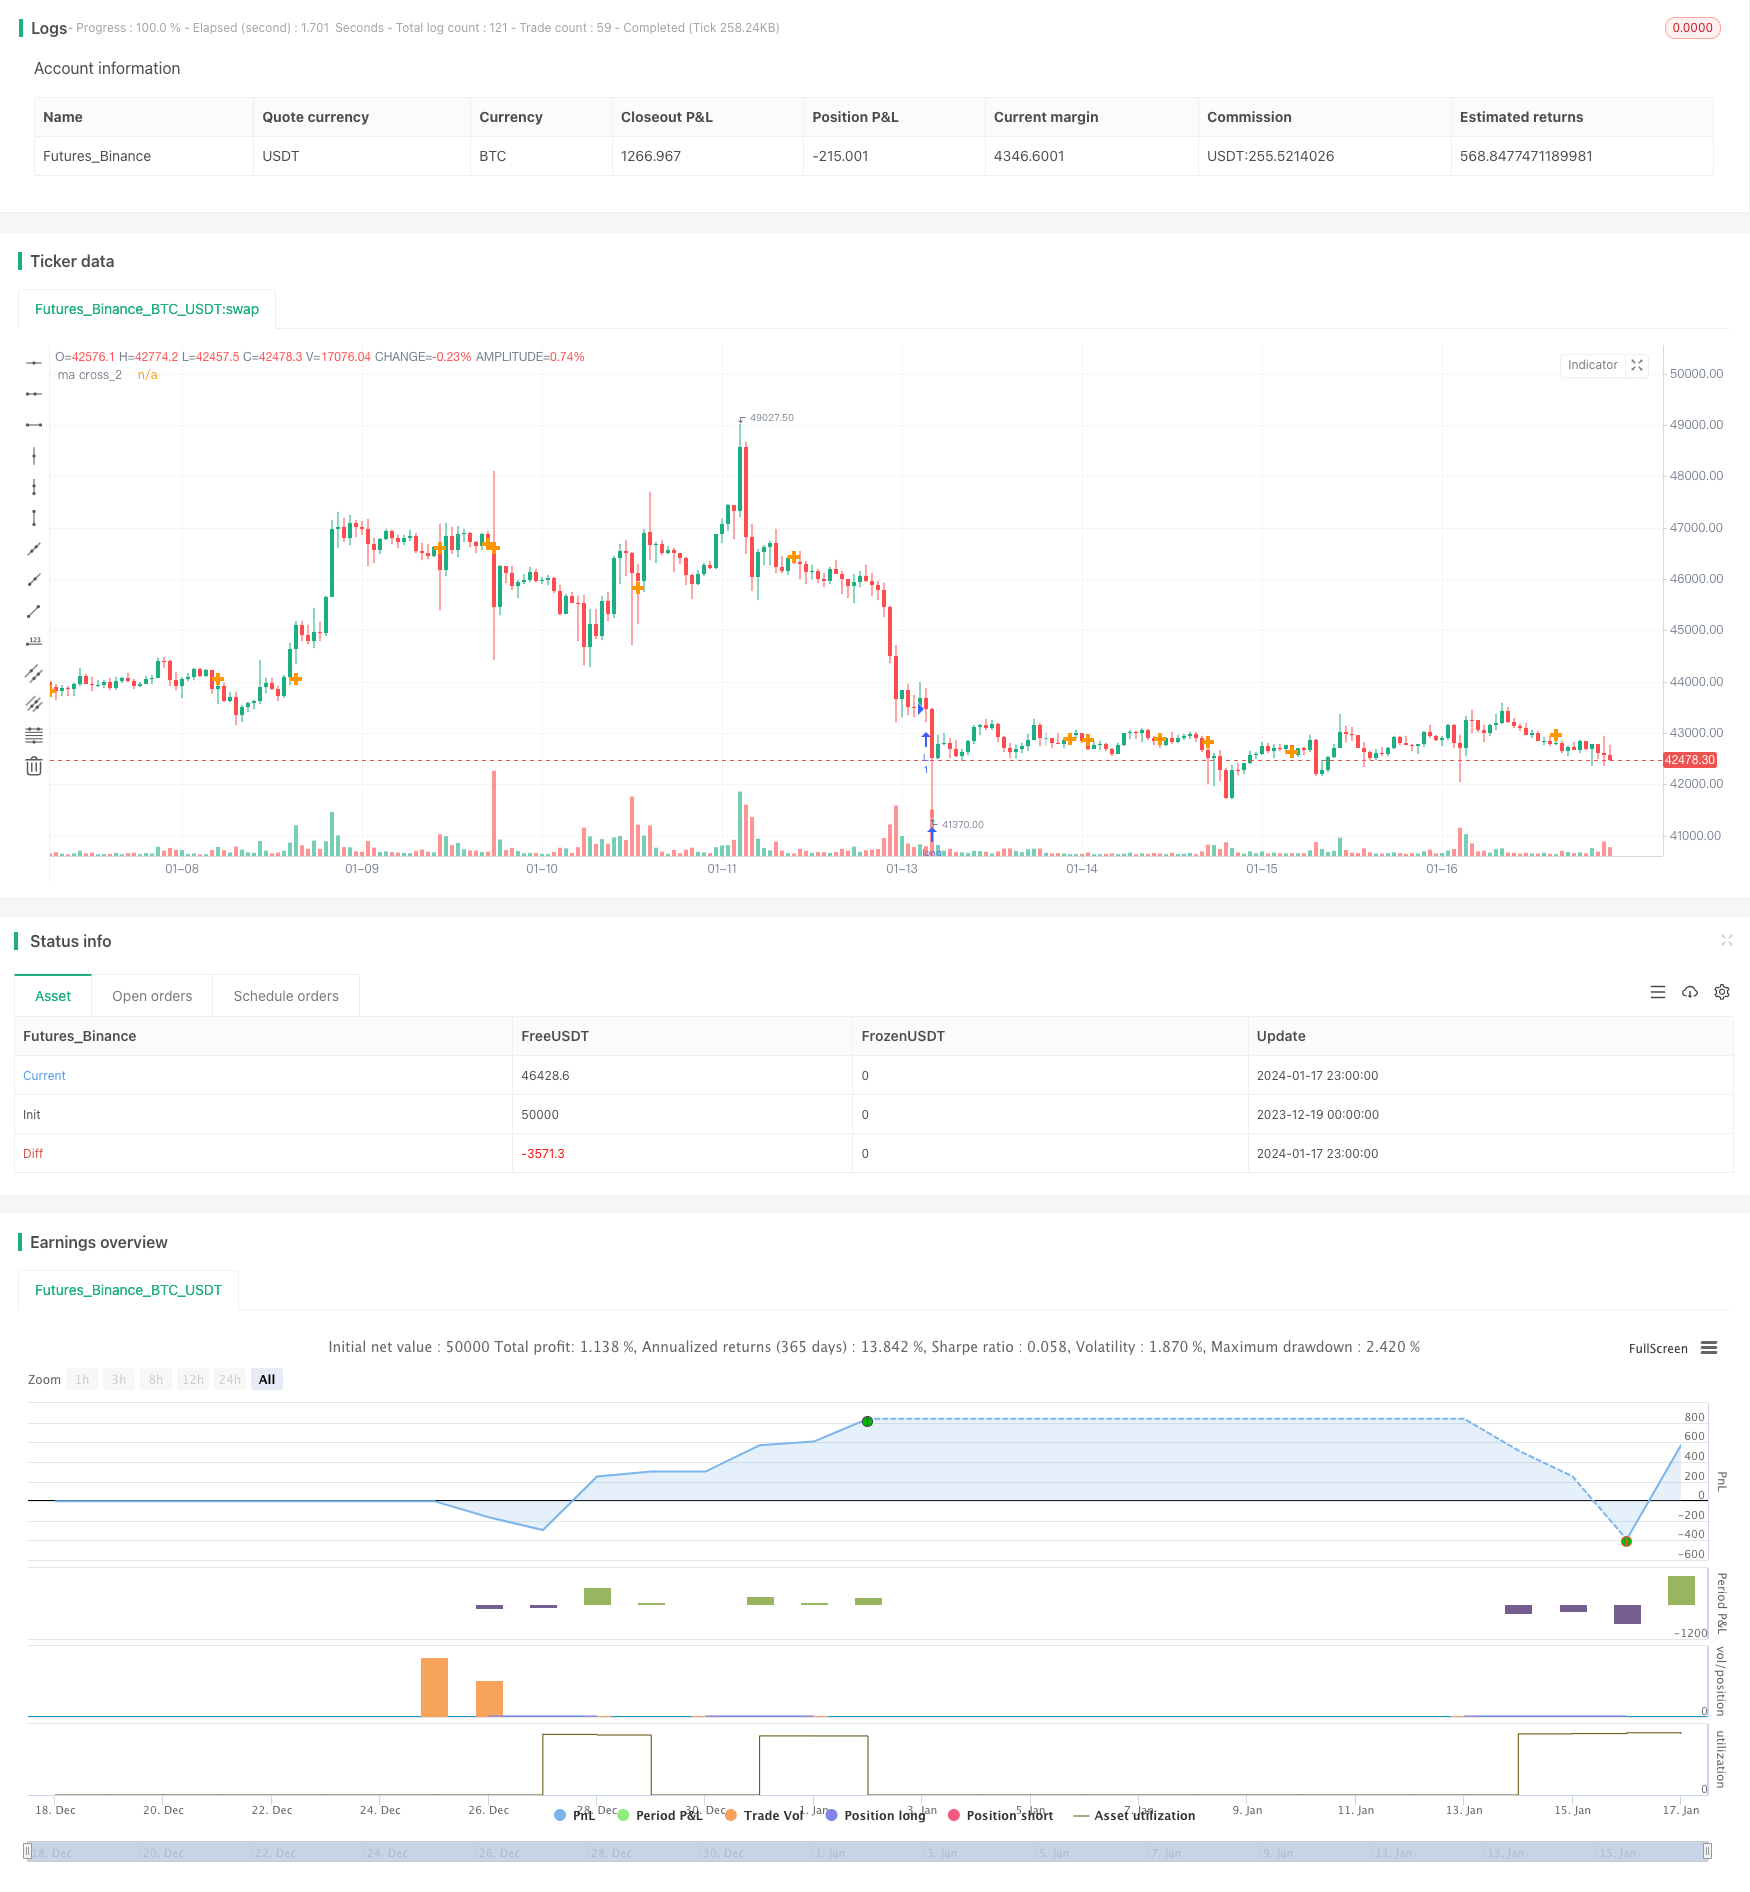
start: 2023-12-19 00:00:00
end: 2024-01-18 00:00:00
period: 1h
basePeriod: 15m
exchanges: [{"eid":"Futures_Binance","currency":"BTC_USDT"}]
*/
//@version=3
strategy(title="Aroon+Williams+MA2+ADX+Aroon Str.", shorttitle="Aroon+Williams+MA2+ADX+Aroon Str.", overlay=true)
//https://cafe.naver.com/watchbot/1945
//<<빙썸 매각 기념>> 바이낸스 이오스 복합지표
//Aroon_1
length_1 = input(264, minval=1, title="Length Aroon_1")
upper_1 = 100 * (highestbars(high, length_1+1) + length_1)/length_1
lower_1 = 100 * (lowestbars(low, length_1+1) + length_1)/length_1
midp_1 = 0
oscillator_1 = upper_1 - lower_1
//osc_1 = plot(oscillator_1, color=red)
//Aroon_2
length_2 = input(72, minval=1, title="Length Aroon_2")
upper_2 = 100 * (highestbars(high, length_2+1) + length_2)/length_2
lower_2 = 100 * (lowestbars(low, length_2+1) + length_2)/length_2
midp_2 = 0
oscillator_2 = upper_2 - lower_2
//osc_2 = plot(oscillator_2, color=red)
//Aroon_3
length_3 = input(137, minval=1, title="Length Aroon_3")
upper_3 = 100 * (highestbars(high, length_3+1) + length_3)/length_3
lower_3 = 100 * (lowestbars(low, length_3+1) + length_3)/length_3
midp_3 = 0
oscillator_3 = upper_3 - lower_3
//osc_3 = plot(oscillator_3, color=red)
//Aroon_4
length_4 = input(62, minval=1, title="Length Aroon_4")
upper_4 = 100 * (highestbars(high, length_4+1) + length_4)/length_4
lower_4 = 100 * (lowestbars(low, length_4+1) + length_4)/length_4
midp_4 = 0
oscillator_4 = upper_4 - lower_4
//osc_4 = plot(oscillator_4, color=red)
//Ma double
short_ma_1 = sma(close, 9)
long_ma_1 = sma(close, 21)
// plot(short_ma_1, color = red)
// plot(long_ma_1, color = green)
// plot(cross(short_ma_1, long_ma_1) ? short_ma_1 : na, style = cross, linewidth = 4)
short_ma_2 = sma(close, 9)
long_ma_2 = sma(close, 21)
// plot(short_ma_2, color = red)
// plot(long_ma_2, color = green)
plot(cross(short_ma_2, long_ma_2) ? short_ma_2 : na, transp= 100, title = "ma cross_2", style = cross, linewidth = 4)
//BB
length_bb = input(270, minval=1, title="BB length")
src_bb = input(close, title="Source")
mult_bb = input(2.0, minval=0.001, maxval=50, title="BB mult")
basis_bb = sma(src_bb, length_bb)
dev_bb = mult_bb * stdev(src_bb, length_bb)
upper_bb = basis_bb + dev_bb
lower_bb = basis_bb - dev_bb
// plot(basis_bb, color=red)
// p1 = plot(upper_bb, color=blue)
// p2 = plot(lower_bb, color=blue)
// fill(p1, p2)
//Williams
length_wil = input(130, minval=1, title="Length Williams %R")
upper_wil = highest(length_wil)
lower_wil = lowest(length_wil)
out_wil = 100 * (close - upper_wil) / (upper_wil - lower_wil)
// plot(out_wil)
// band1 = hline(-20)
// band0 = hline(-80)
// fill(band1, band0)
//ADX
adxlen = input(14, title="ADX Smoothing")
dilen = input(145, title="DI Length")
dirmov(len) =>
up_adx = change(high)
down_adx = -change(low)
plusDM = na(up_adx) ? na : (up_adx > down_adx and up_adx > 0 ? up_adx : 0)
minusDM = na(down_adx) ? na : (down_adx > up_adx and down_adx > 0 ? down_adx : 0)
truerange = rma(tr, len)
plus_adx = fixnan(100 * rma(plusDM, len) / truerange)
minus_adx = fixnan(100 * rma(minusDM, len) / truerange)
[plus_adx, minus_adx]
adx(dilen, adxlen) =>
[plus_adx, minus_adx] = dirmov(dilen)
sum_adx = plus_adx + minus_adx
adx = 100 * rma(abs(plus_adx - minus_adx) / (sum_adx == 0 ? 1 : sum_adx), adxlen)
sig_adx = adx(dilen, adxlen)
// plot(sig_adx, color=red, title="ADX")
//ADX 2
adxlen_2 = input(14, title="ADX Smoothing")
dilen_2 = input(150, title="DI Length")
dirmov_2(len) =>
up_adx_2 = change(high)
down_adx_2 = -change(low)
plusDM_2 = na(up_adx_2) ? na : (up_adx_2 > down_adx_2 and up_adx_2 > 0 ? up_adx_2 : 0)
minusDM_2 = na(down_adx_2) ? na : (down_adx_2 > up_adx_2 and down_adx_2 > 0 ? down_adx_2 : 0)
truerange_2 = rma(tr, len)
plus_adx_2 = fixnan(100 * rma(plusDM_2, len) / truerange_2)
minus_adx_2 = fixnan(100 * rma(minusDM_2, len) / truerange_2)
[plus_adx_2, minus_adx_2]
adx_2(dilen_2, adxlen_2) =>
[plus_adx_2, minus_adx_2] = dirmov_2(dilen_2)
sum_adx_2 = plus_adx_2 + minus_adx_2
adx_2 = 100 * rma(abs(plus_adx_2 - minus_adx_2) / (sum_adx_2 == 0 ? 1 : sum_adx_2), adxlen_2)
sig_adx_2 = adx(dilen_2, adxlen_2)
// plot(sig_adx_2, color=red, title="ADX_2")
//Input Position
//buy position
pos_aroon1 = input(-85, title="Aroon_1 Position Index_Down")
pos_madouble1_short = input(117, title="ma double_1 wma_Short")
pos_madouble1_long = input(86, title="ma double_1 sma_Long")
pos_wil = input(-99, title="Williams Position Index_Down")
pos_adx= input(14, title="ADX Position Index_Up")
pos_aroon2 = input(-39, title="Aroon_2 Position Index_Up")
//sell position
pos_bb = input(120, title="BB Position Index_Up")
pos_aroon_3 = input(99, title="Aroon_3 Position Index_Up")
pos_madouble2_short= input(88, title="ma double_2 ema_Short")
pos_madouble2_long= input(96, title="ma double_2 sma_Long")
pos_adx_2= input(9, title="ADX_2 Position Index_Up")
pos_aroon_4 = input(35, title="Aroon_4 Position Index_Down")
//Condition
longCondition_aroon_1 = (oscillator_1 <= pos_aroon1)
longCondition_ma2 = (pos_madouble1_short > pos_madouble1_long)
longCondition_wil = (out_wil <= pos_wil)
longCondition_adx = (sig_adx >= pos_adx)
longCondition_aroon_2 = (oscillator_2 >= pos_aroon2)
shortCondition_bb = (close > basis_bb)
shortCondition_aroon_3 = (oscillator_3 >= pos_aroon_3)
shortCondition_ma2 = (pos_madouble2_short < pos_madouble2_long)
shortCondition_adx = (sig_adx_2 >= pos_adx_2)
shortCondition_aroon_4 = (oscillator_4 <= pos_aroon_4)
vl_aroon_1 = 0
vl_ma2 = 0
vl_wil = 0
vl_adx = 0
vl_aroon_2 = 0
if longCondition_aroon_1
vl_aroon_1 := 1
if longCondition_ma2
vl_ma2 := 3
if longCondition_wil
vl_wil := 1
if longCondition_adx
vl_adx := -1
if longCondition_aroon_2
vl_aroon_2 := -1
vs_bb = 0
vs_aroon_3 = 0
vs_ma2 = 0
vs_adx = 0
vs_aroon_4 = 0
if shortCondition_bb
vs_bb := 1
if shortCondition_aroon_3
vs_aroon_3 := 1
if shortCondition_ma2
vs_ma2 := 3
if shortCondition_adx
vs_adx := -2
if shortCondition_aroon_4
vs_aroon_4 := -1
// plotshape(vl_aroon_1, title= "vl_aroon_1", location=location.belowbar, color=green, text="vl_aroon_1")
// plotshape(vl_ma2, title= "vl_ma2", location=location.belowbar, color=green, text="\nvl_ma2")
// plotshape(vl_wil, title= "vl_wil", location=location.belowbar, color=green, text="\n\nvl_wil")
// plotshape(vl_adx, title= "vl_adx", location=location.belowbar, color=green, text="\n\n\nvl_adx")
// plotshape(vl_aroon_2, title= "vl_aroon_2", location=location.belowbar, color=green, text="\n\n\n\nvl_aroon_2")
// plotshape(vs_bb, title= "vs_bb", location=location.abovebar, color=orange, text="vs_bb")
// plotshape(vs_aroon_3, title= "vs_aroon_3", location=location.abovebar, color=orange, text="vs_aroon_3\n")
// plotshape(vs_ma2, title= "vs_ma2", location=location.abovebar, color=orange, text="vs_ma2\n\n")
// plotshape(vs_adx, title= "vs_adx", location=location.abovebar, color=orange, text="vs_adx\n\n\n")
// plotshape(vs_aroon_4, title= "vs_aroon_4", location=location.abovebar, color=orange, text="vs_aroon_4\n\n\n\n")
longCondition = (vl_aroon_1 + vl_ma2 + vl_wil + vl_adx + vl_aroon_2) >= 3 ? true : na
shortCondition = (vs_bb + vs_aroon_3 + vs_ma2 + vs_adx + vs_aroon_4) >= 3 ? true : na
buy = longCondition == 1 ? longCondition : na
sell = shortCondition == 1? shortCondition : na
// plotshape(buy, title= "buy", location=location.bottom, color=green, text="buy")
// plotshape(sell, title= "sell", location=location.top, color=orange, text="sell")
// === BACKTEST RANGE ===
FromMonth = input(defval = 8, title = "From Month", minval = 1, maxval = 12)
FromDay = input(defval = 1, title = "From Day", minval = 1, maxval = 31)
FromYear = input(defval = 2018, title = "From Year", minval = 2014)
ToMonth = input(defval = 12, title = "To Month", minval = 1, maxval = 12)
ToDay = input(defval = 31, title = "To Day", minval = 1, maxval = 31)
ToYear = input(defval = 2018, title = "To Year", minval = 2014)
strategy.entry("L", strategy.long, when=(buy))
strategy.close("L", when=(sell))
// strategy.entry("S", strategy.short, when=(sell and (time >= timestamp(FromYear, FromMonth, FromDay, 00, 00)) and (time <= timestamp(ToYear, ToMonth, ToDay, 23, 59))))
// strategy.close("S", when=(buy and (time <= timestamp(ToYear, ToMonth, ToDay, 23, 59))))