概述
双均线价格通道交易策略(Dual Moving Average Price Channel Trading Strategy)是一个融合价格通道指标和均线指标的量化交易策略。该策略通过构建价格通道,判断价格通道方向;同时利用均线判断价格趋势,实现交易信号的产生。
策略原理
双均线价格通道交易策略的核心原理是:
构建价格上轨和价格下轨,形成价格通道。当价格上破上轨时为看涨信号,当价格下破下轨时为看跌信号。
计算均线。当价格在均线之上为看涨趋势,价格在均线之下为看跌趋势。
结合价格通道指标和均线指标,可以产生更可靠的交易信号。具体规则是:
- 多头信号:价格上破下轨且低于均线的时候,做多
- 空头信号:价格下破上轨且高于均线的时候,做空
该策略同时兼顾了价格通道和均线两个指标,能够更准确判断市场走势,过滤假signals,具有一定的稳定性。
优势分析
双均线价格通道交易策略具有以下优势:
结合价格通道和均线两个指标,使交易信号更加可靠,避免产生大量假信号。
利用价格通道判断价格ျ态,运用均线判断价格趋势,两个指标互相验证,更加准确。
策略参数化设计,均线长度和价格通道长度都可以通过参数调整,适应不同品种和周期。
策略信号较为稳定,不会出现信号震荡,降低了交易风险。
策略逻辑简单清晰,容易理解,便于实盘操作。
策略完全基于指标,无需训练,零数据依赖,适用于各种品种和周期。
风险分析
双均线价格通道交易策略也存在一定的风险,主要有:
策略可能会错过价格快速突破上下轨的机会,无法抓住短期趋势。
当价格在上下轨附近波动时,会频繁触发交易信号,增加交易频率。
若期货品种价格波动剧烈,价格通道参数设置不当也会增加交易风险。
策略没有考虑止损逻辑,在亏损扩大时无法有效控制风险。
对应风险的解决方法是:
适当缩短均线周期,使策略更敏感,抓住短期趋势。
增大价格通道长度参数,减少假信号。同时适当放宽入场条件,控制交易频率。
参数优化测试,选择最适合的价格通道参数。
加入移动止损逻辑,降低单笔损失。
优化方向
双均线价格通道交易策略还有进一步优化的空间:
在入场条件上,可以结合其他指标如MACD、KDJ等,实现多指标过滤,使信号更稳定。
可以测试不同参数对策略效果的影响,寻找最优参数组合。如测试不同均线周期参数。
可以加入动态止损模块。当亏损达到一定幅度时止损出场,有效控制风险。
还可以引入机器学习模型,利用历史数据对策略参数进行训练和优化,实现参数的动态调整。
更复杂的改进是运用深度学习算法提取特征和判断信号,使用神经网络代替传统指标,实现策略的智能化。
总结
双均线价格通道交易策略通过双重指标判断,形成比较稳定和可靠的交易信号。同时策略参数化设计,可以灵活调整适应不同品种。该策略结合价格通道和均线的优点,相对简单实用,适合量化交易实盘。当然策略也存在一些改进空间,可以从入场条件、止损、参数优化、智能化等方面进行优化提升。
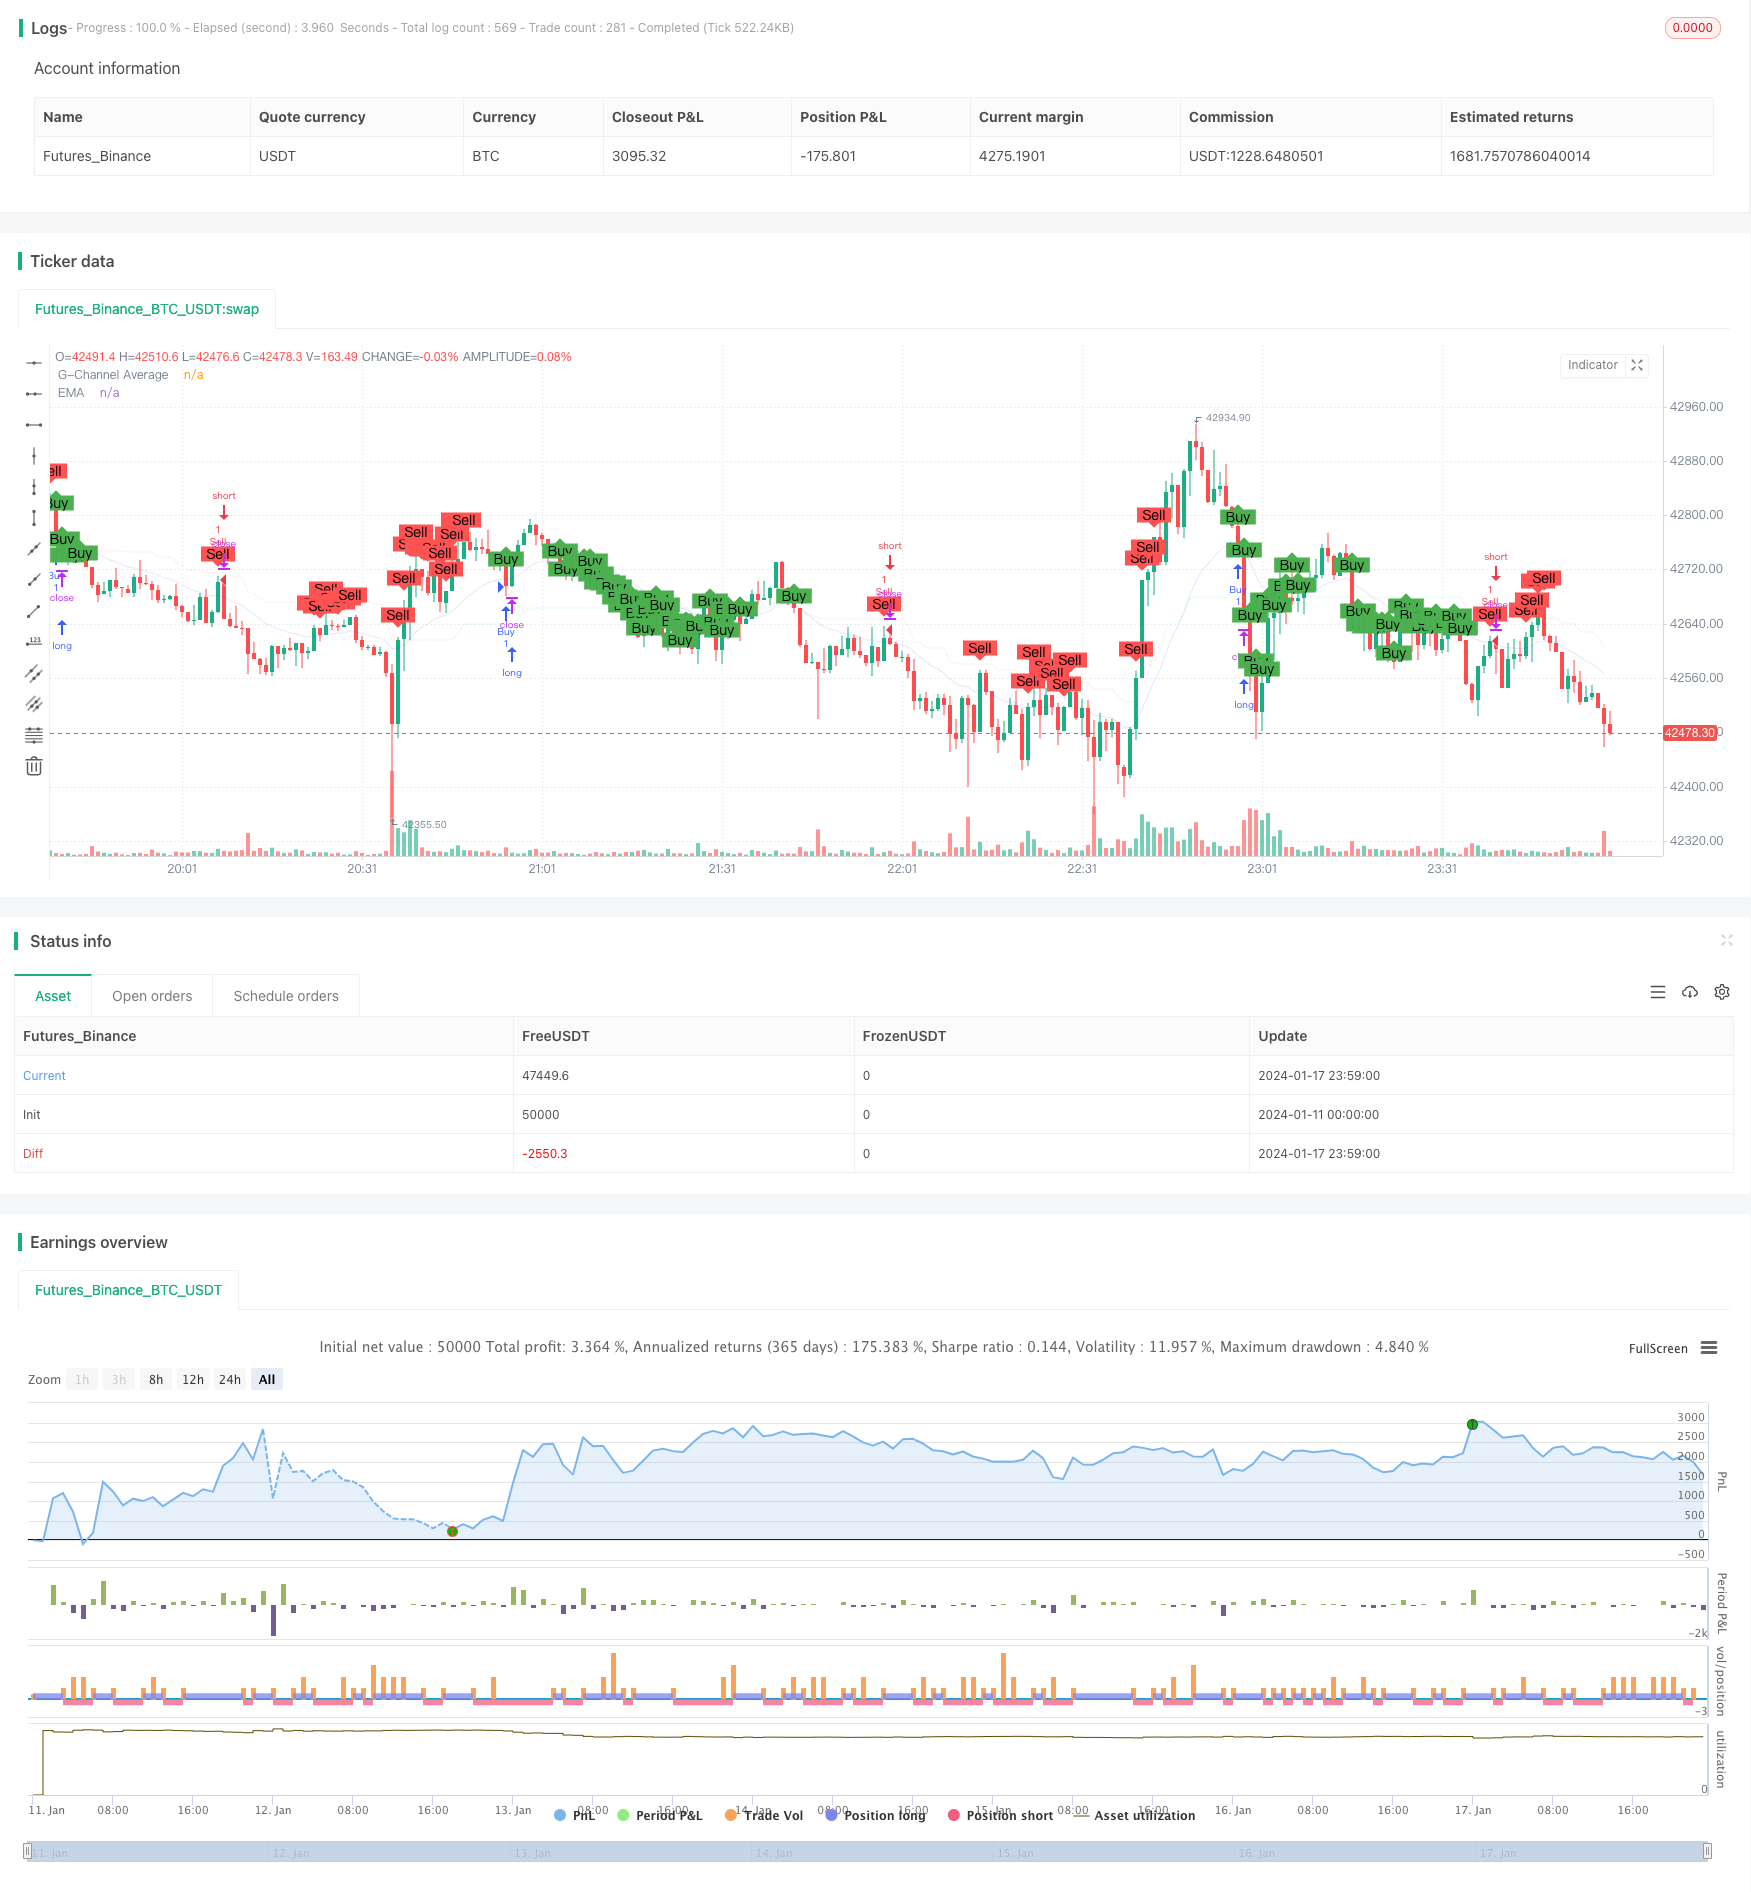
/*backtest
start: 2024-01-11 00:00:00
end: 2024-01-18 00:00:00
period: 1m
basePeriod: 1m
exchanges: [{"eid":"Futures_Binance","currency":"BTC_USDT"}]
*/

// This Pine Script™ code is subject to the terms of the Mozilla Public License 2.0 at https://mozilla.org/MPL/2.0/
// © paparegier

//@version=4
strategy("G-Channel and EMA Strategy", shorttitle="GEMA", overlay=true)

// G-Channel Indicator
length = input(100)
a = 0.0
b = 0.0
a := na(a[1]) ? close : max(close, a[1]) - (a[1] - b[1]) / length
b := na(b[1]) ? close : min(close, b[1]) + (a[1] - b[1]) / length
avg = avg(a, b)

crossup = b[1] < close[1] and b > close
crossdn = a[1] < close[1] and a > close
bullish = barssince(crossdn) <= barssince(crossup)

// EMA Indicator
emaLength = input(20, title="EMA Length")
emaValue = ema(close, emaLength)

// Strategy Conditions
buyCondition = bullish and close < emaValue
sellCondition = not bullish and close > emaValue

// Execute Strategy
strategy.entry("Buy", strategy.long, when=buyCondition)
strategy.entry("Sell", strategy.short, when=sellCondition)

// Plotting
plot(avg, color=color.new(bullish ? color.lime : color.red, 90), linewidth=1, title="G-Channel Average")
plot(emaValue, color=color.rgb(0, 0, 255, 90), linewidth=1, title="EMA")

// Mark Buy and Sell Signals
plotshape(series=buyCondition, title="Buy Signal", color=color.green, style=shape.labelup, text="Buy", size=size.small)
plotshape(series=sellCondition, title="Sell Signal", color=color.red, style=shape.labeldown, text="Sell", size=size.small)