Quantitative Strategy of MA Strength Trend Tracking

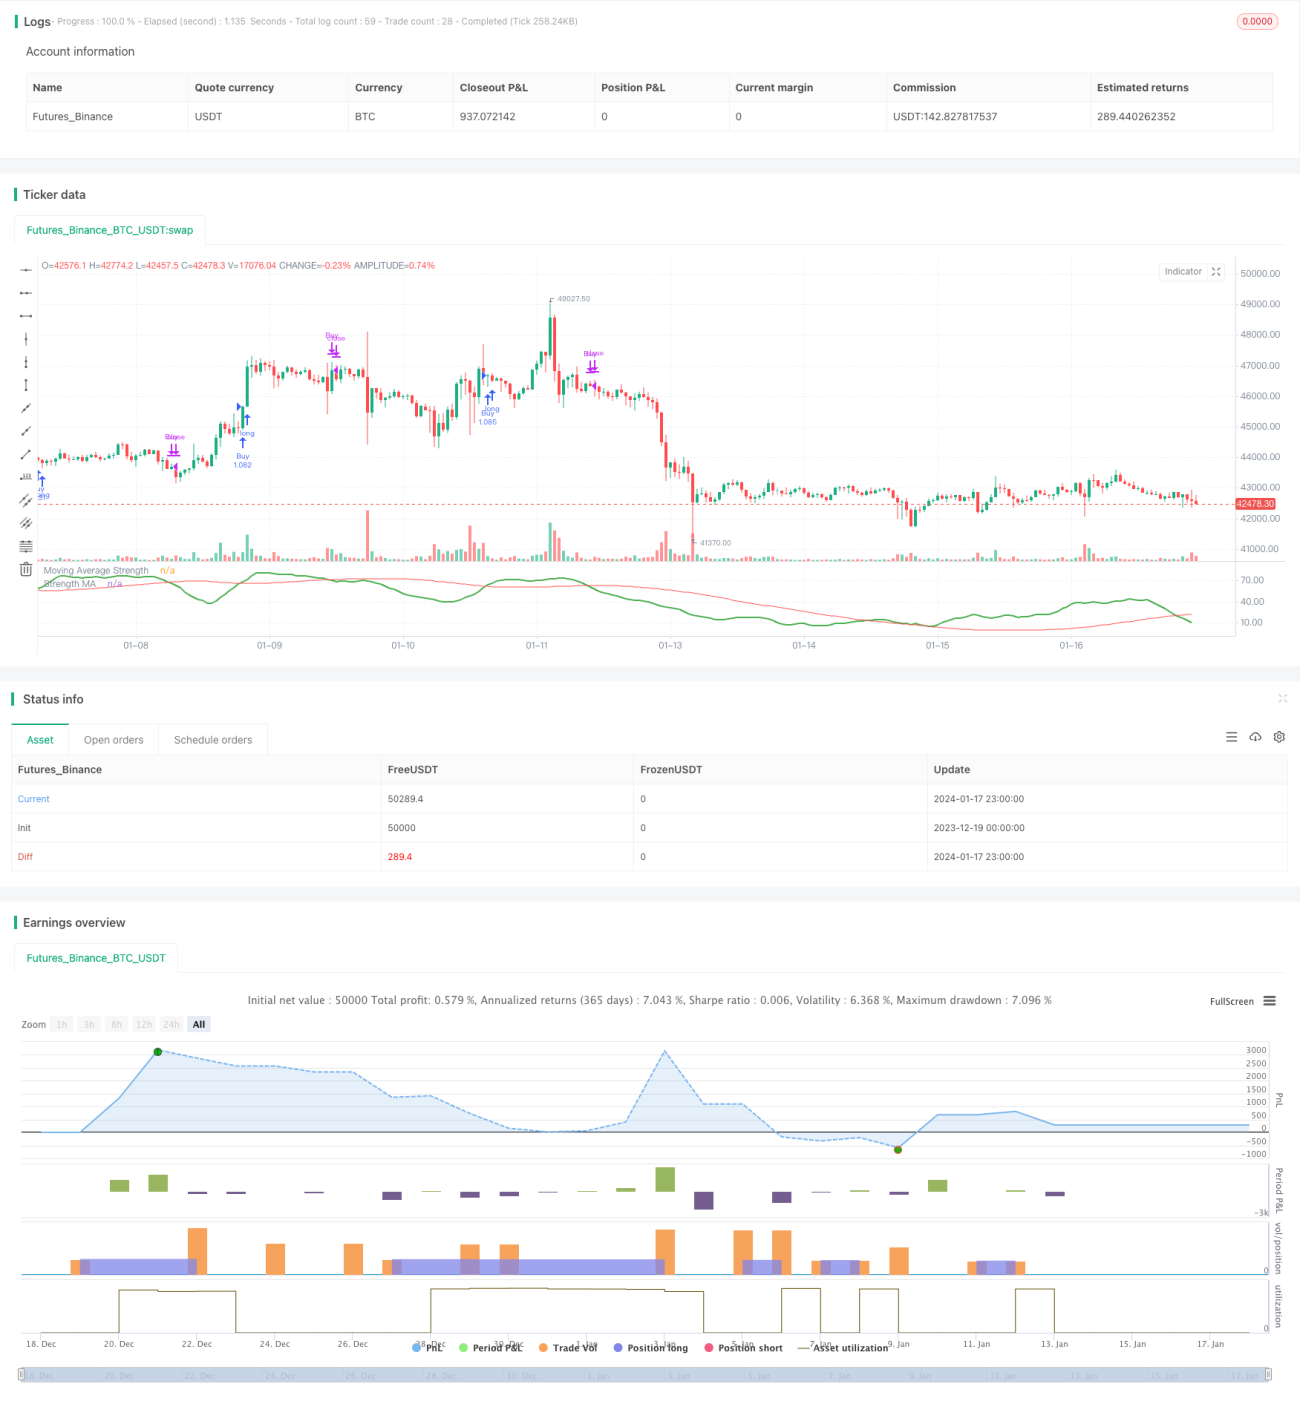
Overview
This strategy evaluates the strength of market trends by calculating the strength of moving averages (MA) across different timeframes, and tracks trends accordingly. When short-term MAs consecutively rally upwards, they score higher and form a “MA Strength” indicator. When this indicator crosses over its own long-term MA, buy signals are generated. The strategy allows users to configure MA combinations across short and long terms to track trends over customized cycles.
Strategy Logic
- Calculate the 5-day, 10-day, 20-day MAs etc. Judge if prices break above each MA, breakouts score points which accumulate into a “MA Strength” indicator.
- Apply moving average on the “MA Strength”, forming a MA indicator to determine long/short signals.
- Users can configure cycle parameters like: short-term MA combination, long-term MA period, entry conditions etc.
The core of this strategy is to determine the long/short condition of the MA indicator, which reflects the average strength of the MA combination. The MA combination comprehensively judges the trend, while the MA indicator determines persistence.
Advantage Analysis
- Multi-dimensional model to evaluate trend strength. A single MA line cannot determine sufficient strength; this strategy measures multi-MA breakouts to ensure strength before signaling, ensuring reliability.
- Customizable cycle tracking. Adjusting short-term MA parameters can capture trends across different levels; adjusting long-term MA parameters controls exit pace. Users can configure cycles based on market conditions.
- Long only avoids wrong kills and tracks persistent uptrends. By only going long instead of shorting, losses from trend reversals can be avoided.
Risk Analysis
- Retracement risks exist when short-term MA crosses below long-term MA, which can be large losses. Stop loss methods should be used to limit losses.
- Reversal risks are inevitable in long-term trends, requiring timely stop loss exiting. It is recommended to judge cycle highs using techniques like channels to control reversal risks.
- Parameter risk. Improper parameter tuning can lead to wrong signals. Parameters should be optimized and stabilized for different products.
Optimization Directions
- Additional filter signals with more indicators. Volume can be used to avoid false breakouts by only signaling on volume confirmation.
- Add stop loss methods. Moving stop loss, curve stop loss can reduce retracement losses. Consider take profit methods to lock in profits and avoid reversals.
- Consider futures and forex products. MA breakouts better suit trending products. Evaluate parameter stability across products to select the optimal.
Conclusion
This strategy judges price trends by calculating a MA strength indicator and uses MA crosses as signal source to track trends. Its advantage lies in accurately determining trend strength for reliability. Main risks come from trend reversals and parameter tuning. By optimizing signal accuracy, adding stop losses, selecting suitable products, good returns can be obtained.
/*backtest
start: 2023-12-19 00:00:00
end: 2024-01-18 00:00:00
period: 1h
basePeriod: 15m
exchanges: [{"eid":"Futures_Binance","currency":"BTC_USDT"}]
*/

// This source code is subject to the terms of the Mozilla Public License 2.0 at https://mozilla.org/MPL/2.0/
// © HeWhoMustNotBeNamed

//@version=4- 1