Trend Following Strategy Based on Historical High

Author: ChaoZhang, Date: 2024-01-22 08:59:34
Tags:

img

Overview

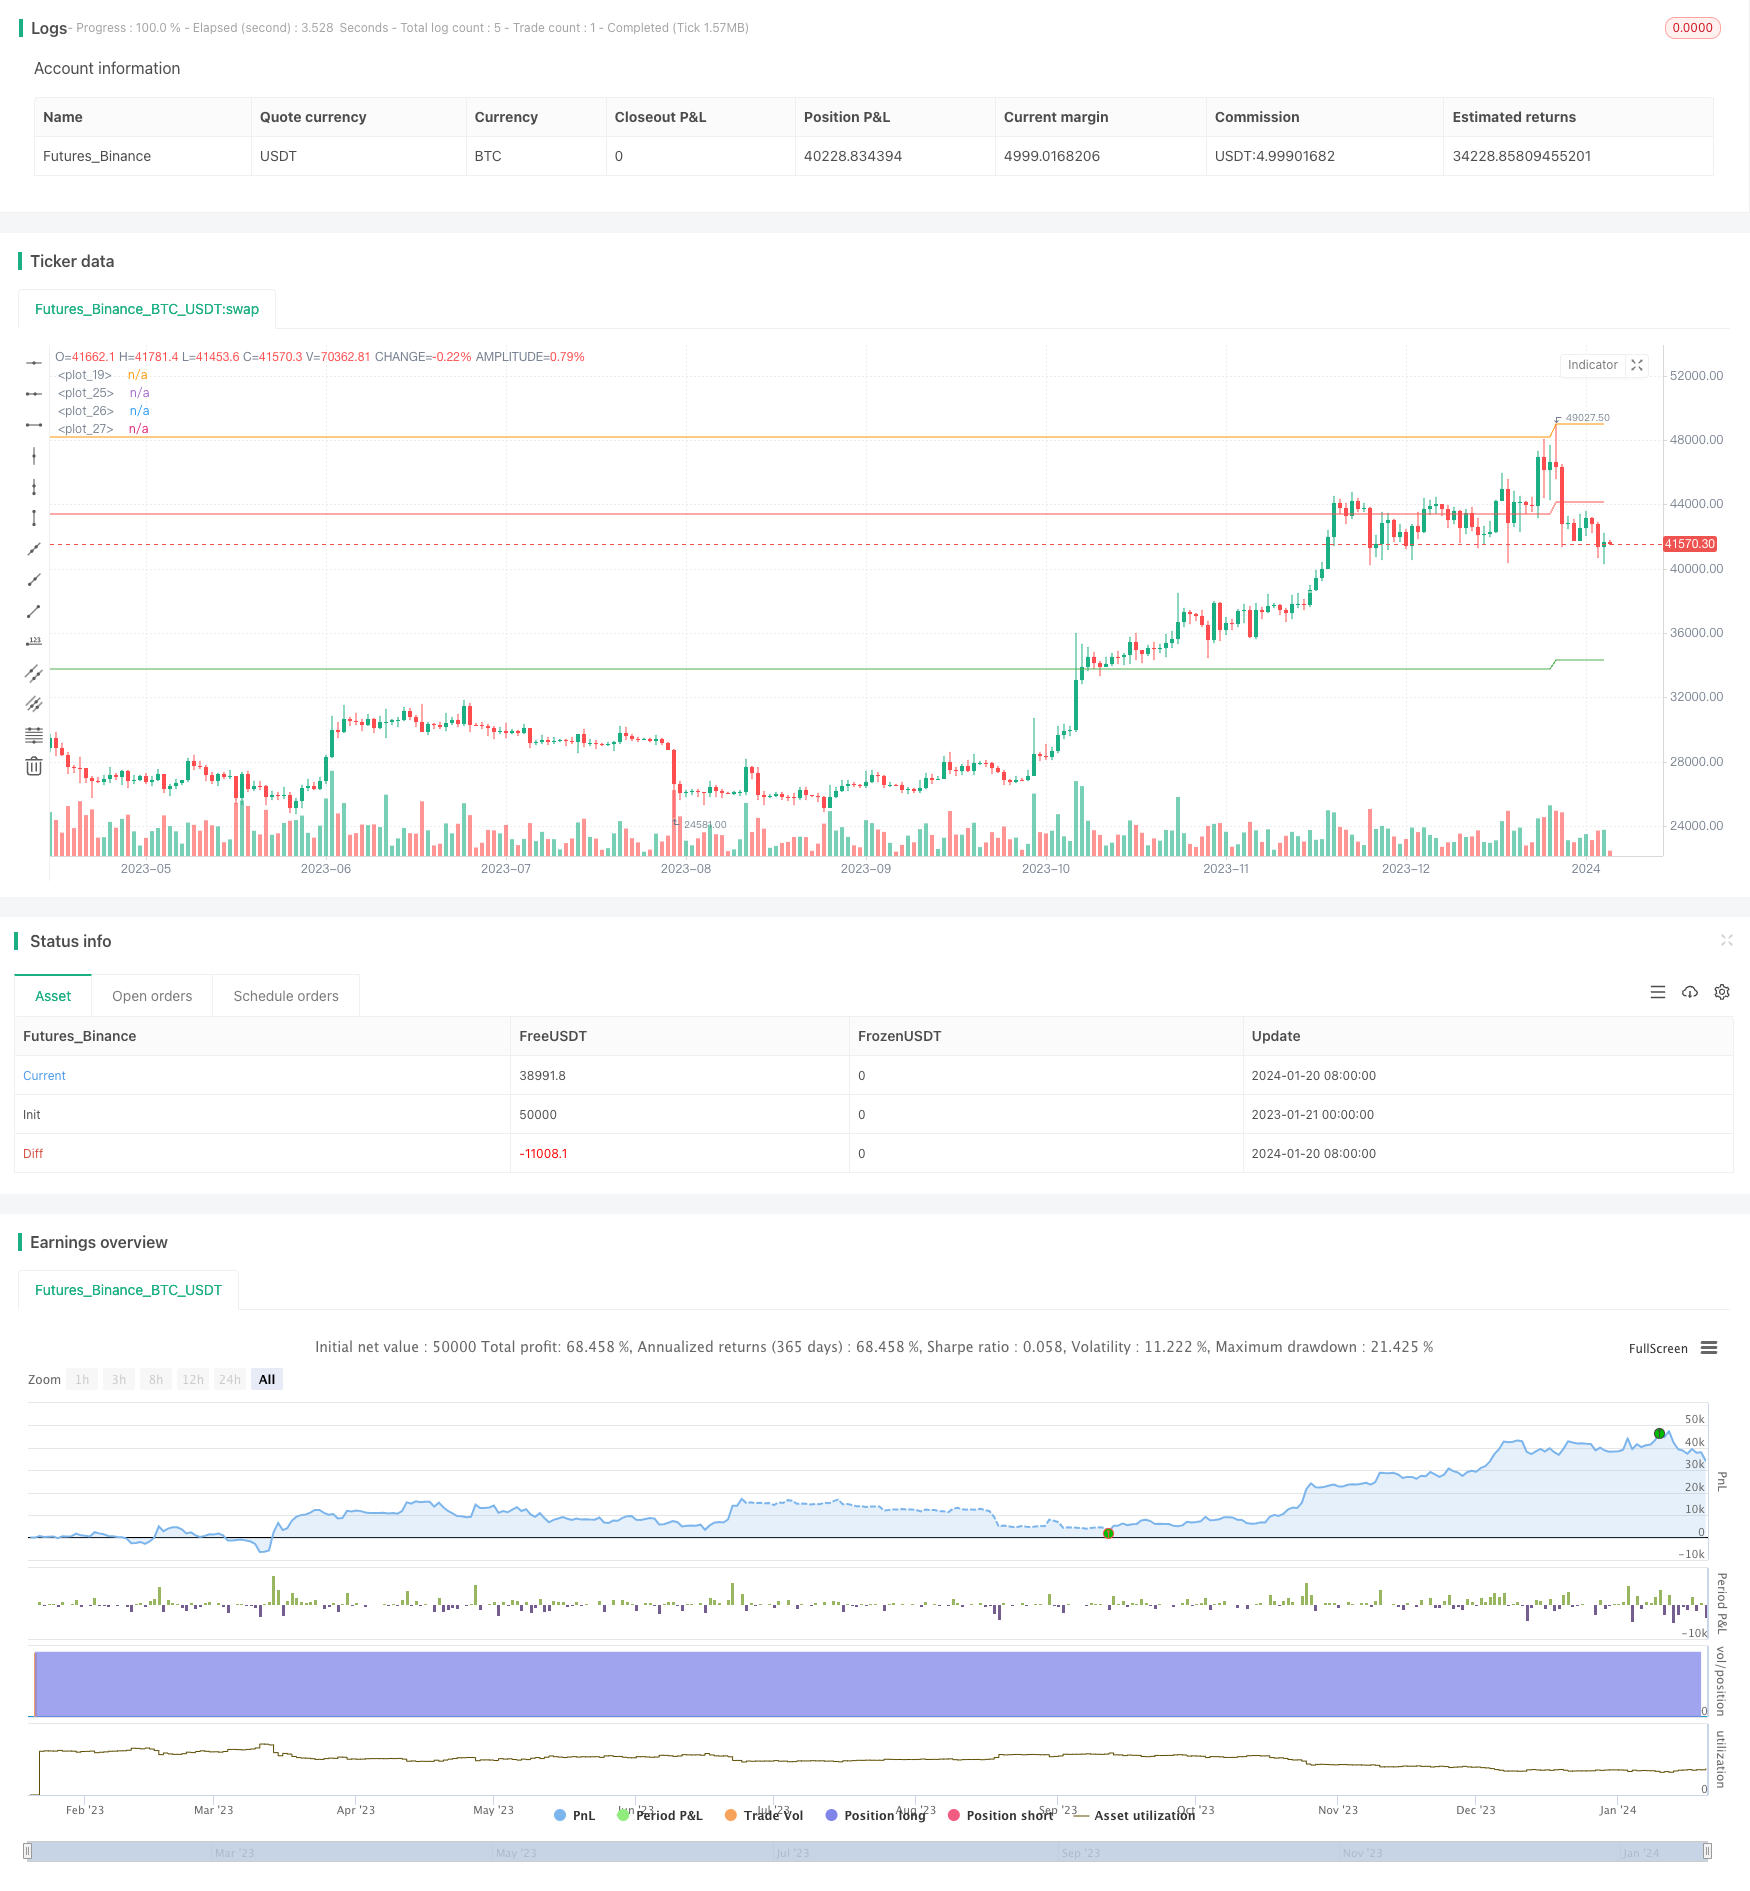
This strategy mainly tracks the historical highest price of securities. It buys when the price falls back to a certain percentage of the highest price and sells when the price breaks through the historical highest price again. It belongs to the trend following strategy.

Strategy Principle

The strategy first records the highest price of the security from January 1, 2011 to the present, which is defined as the highestHigh variable. Then it draws the horizontal line allTimeHigh of this highest price.

During operation, it judges whether the highest price of the day has hit a new high every day. If it hits a new high, it updates the highestHigh variable and redraws the allTimeHigh horizontal line.

There are 3 important horizontal lines in this strategy:

  1. buyzone=highestHigh*0.9: 90% of the highest price, representing the opportunity of strong pullback

  2. buyzone2=highestHigh*0.8: 80% of the highest price, representing a relatively attractive pullback position

  3. sellzone=highestHigh*0.99: 99% of the highest price, representing the opportunity to determine the trend reversal

It sends a buy signal when the price falls to the 80% line (buyzone2); it sends a sell signal when the price breaks through the 99% line (sellzone) of the historical highest price again.

The main judgment of this strategy is to track the historical highest price and different ratio level lines. It belongs to a typical trend following strategy.

Advantage Analysis

The biggest advantage of this strategy is that it can capture long-term uptrends. By waiting for pullbacks and then entering, it achieves the effect of buying low and selling high. The specific advantages are as follows:

  1. It can capture the long-term uptrend opportunities of stocks. Tracking the highest price is an important basis for judging trends.

  2. The position of 80% pullback of the highest price represents the optimal risk-return ratio, which can ensure the profit margin after the rise while limiting the risk of decline

  3. The 99% of historical high acts as a stop loss line to maximize profits while controlling risks

  4. Can be used to test whether the stock has entered a structural upward trend opportunity. The new high of highest price represents the strengthening of corporate strength

  5. Large adjustable parameter space can be optimized personally for different stocks

Therefore, this strategy maximizes the returns from the uptrend of stocks while avoiding the short-term adjustment risks. It is a trend following strategy with very good risk-reward ratio.

Risk Analysis

The main risk of this strategy is the probability that the price may hit a new low and continue to decline after buying. The main risks include:

  1. The probability of continued decline or limit down after buying, may face losses

  2. The highest price actually represents the frenzy of chasing rises and killing falls, the momentum for continued upside may be insufficient

  3. If the parameters are set improperly, there will be different problems if the stop loss point is too high or too low

  4. Trading frequency may be low, vulnerable to external environmental impacts such as market trends

  5. It does not consider the fundamentals and valuation of individual stocks, and the basis for selecting stocks to buy is weak

The main solution is: rationally evaluate the fundamentals to ensure stock selection quality; adjust parameters such as purchase ratio and stop loss to optimize strategies; consider combining with other strategies, etc.

Optimization Directions

The main optimization directions of this strategy are parameter adjustment, stock selection rules, and improvement of stop-loss methods. Specifically:

  1. Optimize buy and stop loss technical indicators, such as KD, MACD to avoid high points

  2. Improve stock selection rules, add fundamentals and valuation metrics to ensure stock quality

  3. Dynamically adjust parameter ratios and link with the broader market to ensure the rationality of parameters

  4. Set moving stop loss or time stop loss to optimize stop loss methods and positions

  5. Consider combining with other factor strategies to form multi-factor models and improve stability

  6. Add momentum indicators to avoid low prosperity periods after the rise of the stock

Therefore, the main optimization directions are to improve stock selection rules, parameter adjustment, and stop-loss methods, while further improving stability and risk-adjusted returns on the basis of following trends.

Summary

This strategy belongs to the typical trend following strategy based on historical new highs. It can effectively capture the long-term uptrend of stocks through technical pullbacks to obtain a superior risk-reward ratio. But due to the lack of consideration of fundamentals, the stability and risk resistance are weaker. The key optimization directions are to improve stock selection rules, adjust parameters and stop losses, and optimize stop-loss mechanisms. If used in conjunction with other strategies through a multi-factor model, it can form a quantitative stock selection and trading strategy with optimal risk-reward ratio.


/*backtest
start: 2023-01-21 00:00:00
end: 2024-01-21 00:00:00
period: 1d
basePeriod: 1h
exchanges: [{"eid":"Futures_Binance","currency":"BTC_USDT"}]
*/

//@version=4
strategy("All-time-high", "ATH", overlay=true, initial_capital=10000, default_qty_value=100, default_qty_type=strategy.percent_of_equity, pyramiding=1, commission_type=strategy.commission.cash_per_contract, commission_value=0.000)

// input
Athlw = input(title="All-time-high line widths", type=input.integer, defval=4, minval=0, maxval=4)
Athlc = input(title="All-time-high line color", type=input.color, defval=color.new(color.fuchsia,50))
years = input(title="Years back to search for an ATH", type=input.integer, defval=6,minval=0, maxval=100)

var float   highestHigh = 0
// var line    allTimeHigh = line.new(na, na, na, na, extend=extend.both, color=Athlc, width=Athlw)

if high > highestHigh
    highestHigh := high

// if barstate.islast
//     line.set_xy1(allTimeHigh, bar_index-1, highestHigh)
//     line.set_xy2(allTimeHigh, bar_index,   highestHigh)

plot(highestHigh)
buyzone=highestHigh*0.9
buyzone2=highestHigh*0.8
buyzone3=highestHigh*0.7
sellzone=highestHigh*0.99

plot(buyzone, color=color.red)
plot(buyzone2, color=color.white)
plot(buyzone3, color=color.green)

begin = timestamp(2011,1,1,0,0)
end = timestamp(2022,4,19,0,0)

longCondition = close<buyzone2
if (longCondition)
    strategy.entry("Buy", strategy.long)
closeCondition = close>sellzone
if (closeCondition)
    strategy.close("Buy", strategy.long)


More