概述
该策略是对drkhodakarami的规模归一化向量策略的改进,主要增加了激活函数,以提高策略的性能。策略利用时间轴差分计算市场的变化率,并通过阈值判断做多做空信号。同时,策略引入了swish、ReLU和step激活函数,可平滑差分序列,提高信号判断的准确性。
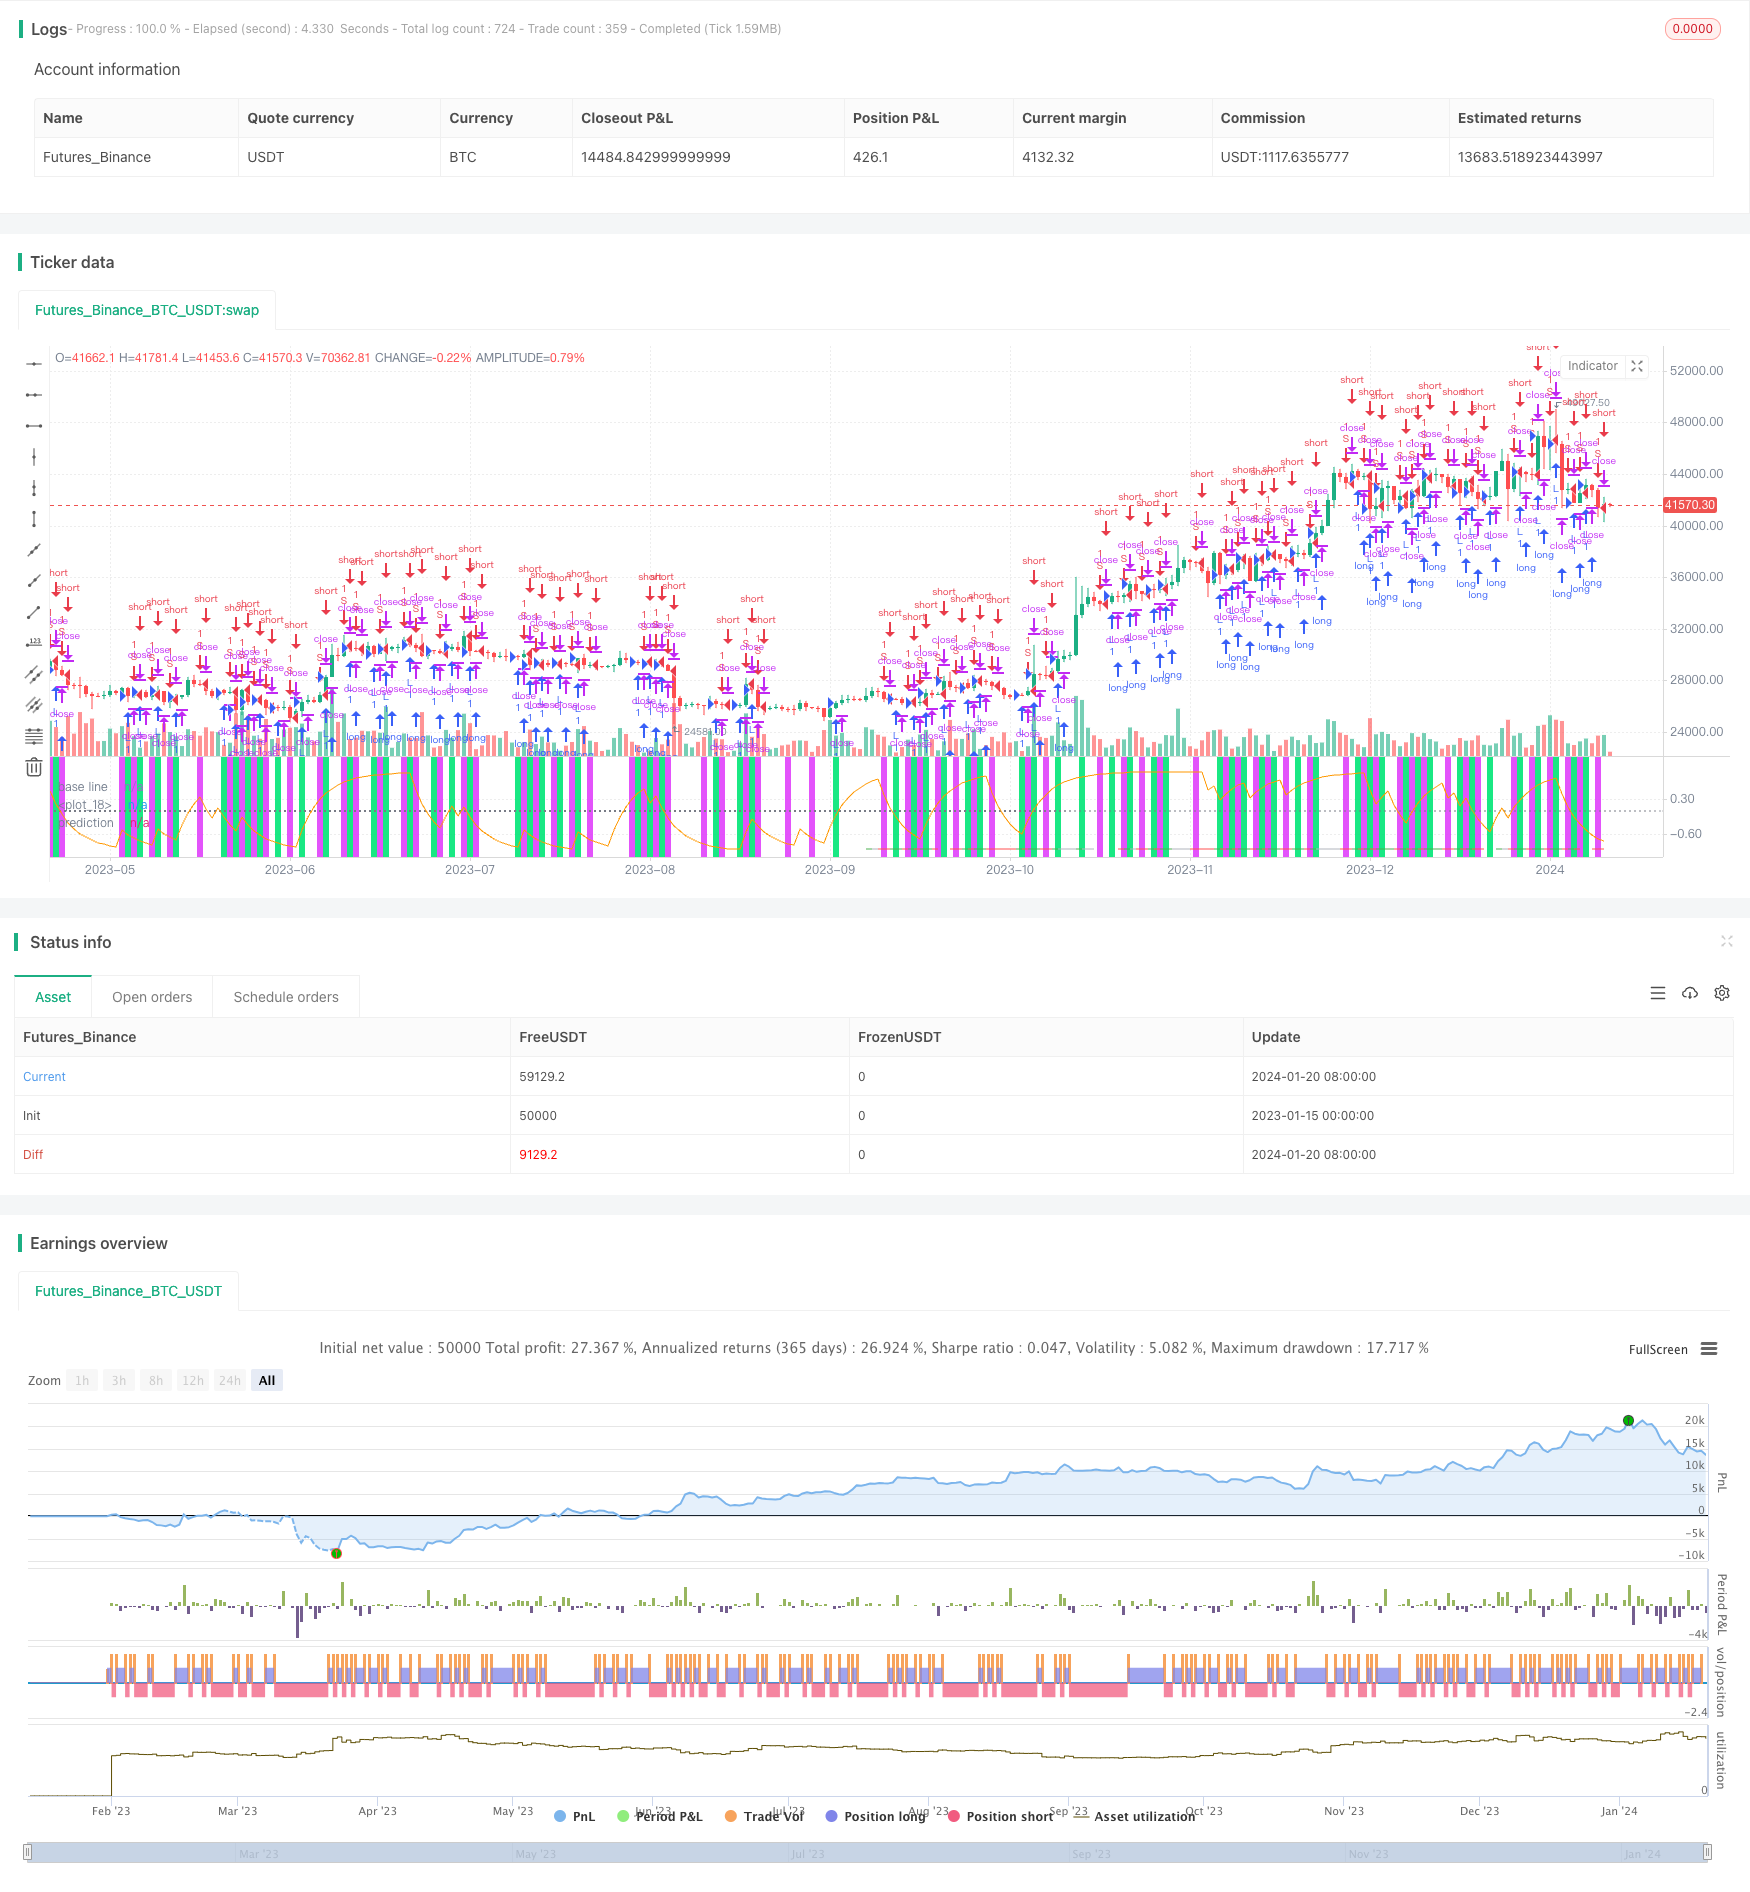
策略原理
- 计算close价格在设置时间轴上的差分百分比变化率x
- 将x传递给激活函数,得到处理后的序列p
- 设置正负阈值th,当p上穿th时做多,下穿-th时做空
- 关闭重绘避免假信号
优势分析
- 引入激活函数,可滤波噪声,提高信号判断质量
- 新增开仓平仓逻辑,可自动交易
- 增加参数自定义空间,适应更多市场
- 可视化设计优秀,直观反映交易信号
风险分析
- 阈值设定不当可能导致错失交易机会
- 激活函数选择不当可能过滤市场信息
- 需测试重绘引起的信号失真问题
解决方法:
- 调整阈值参数,寻找最佳数值
- 尝试不同的激活函数,找到最匹配的
- 添加重绘检测逻辑,确认信号有效性
优化方向
- 增加自适应阈值设定
- 优化激活函数参数
- 加入自动止损逻辑
- 结合更多因子过滤信号
总结
该策略在drkhodakarami的基础上,引入激活函数提高性能表现,通过参数优化空间的拓展,可更好地适应市场的变化。同时可视化设计出色,直观地反映交易机会。后续可继续优化激活函数与阈值设定,并增加止损逻辑与更多信号过滤,可望获得更好的策略效果。
策略源码
/*backtest
start: 2023-01-15 00:00:00
end: 2024-01-21 00:00:00
period: 1d
basePeriod: 1h
exchanges: [{"eid":"Futures_Binance","currency":"BTC_USDT"}]
*/

//@version=4
// author: capissimo
strategy("Scaled Normalized Vector Strategy, ver.4", precision=2, overlay=false)
// This is a modification of my Scaled Normalized Vector Strategy
// original: Drkhodakarami (https://www.tradingview.com/script/Fxv2xFWe-Normalized-Vector-Strategy-By-Drkhodakarami-Opensource/)

price    = input(close,  "Price Data")
tf       = input(18,     "Timeframe", minval=1, maxval=1440)
thresh   = input(14.,    "Threshold", minval=.1, step=.1)
div      = input(1000000,"Divisor", options=[1,10,100,1000,10000,100000,1000000,10000000,100000000])
mmx      = input(233,    "Minimax Lookback", options=[1, 2, 3, 5, 8, 13, 21, 34, 55, 89, 144, 233, 377, 610, 987, 1597, 2584])
showVol  = input(false,  "Volume")
useold   = input(true,   "Use Old System")
method   = input("Swish", "Activation", options=["Step", "LReLU", "Swish", "None"])

scaleMinimax(X, p, min, max) =>
    hi = highest(X, p), lo = lowest(X, p)
    (max - min) * (X - lo)/(hi - lo) + min

getdiff(prc, tf) =>
    prev  = scaleMinimax((useold ? security(syminfo.tickerid, tostring(tf), prc[1], barmerge.gaps_off, barmerge.lookahead_on)
                                 : security(syminfo.tickerid, tostring(tf), prc[1])), tf, 0, 1)
    curr  = scaleMinimax((useold ? security(syminfo.tickerid, tostring(tf), hlc3, barmerge.gaps_off, barmerge.lookahead_on)
                                 : security(syminfo.tickerid, tostring(tf), hlc3)), tf, 0, 1)
    (curr/prev) - 1

relu(x) => max(x, 0)
lrelu(x, alpha) => relu(x) - alpha * relu(-x)
step(x) => x >= 0 ? 1 : -1
log2(x) => log(x) / log(2)
sigmoid(x) => 1 / (1 + exp(-x))
swish(x) => x * sigmoid(x)

f(m) => method==m

vol  = useold ? security(syminfo.tickerid, tostring(tf), volume, barmerge.gaps_off, barmerge.lookahead_on)
              : security(syminfo.tickerid, tostring(tf), volume)
obv  = cum(change(price) > 0 ? vol : change(price) < 0 ? -vol : 0*vol)
prix = showVol ? obv : price
x    = getdiff(prix, tf)
p    = f("Swish") ? swish(x) : f("Step") ? step(x) : f("LReLU") ? lrelu(x, .8) : x
th   = thresh/div
long = crossover(p, th)
short= crossunder(p, -th)

lime  = color.new(color.lime, 10), fuchsia = color.new(color.fuchsia, 10),
black = color.new(color.black, 100), gray = color.new(color.gray, 50)
bg    = long ? lime : short ? fuchsia : black
cl    = p > th ? color.green : p < -th ? color.red : color.silver

bgcolor(bg, editable=false)
plot(scaleMinimax(th, mmx, -1, 1), color=lime, editable=false, transp=0)
hline(0, linestyle=hline.style_dotted, title="base line", color=gray, editable=false)
plot(scaleMinimax(-th, mmx, -1, 1), color=fuchsia, editable=false, transp=0)
plot(scaleMinimax(p, mmx, -1, 1), color=cl, style=plot.style_histogram, transp=70, editable=false)
plot(scaleMinimax(p, mmx, -1, 1), color=cl, style=plot.style_linebr, title="prediction", transp=0, editable=false)

strategy.entry("L", true, 1, when=long)
strategy.entry("S", false, 1, when=short)

alertcondition(long, title='Long', message='Long Signal!')
alertcondition(short, title='Short', message='Short Signal!')

//*** Karobein Oscillator
per  = input(8, "Karobein Osc Lookback")

prix2 = ema(price, per)
a = ema(prix2 < prix2[1] ? prix2/prix2[1] : 0, per)
b = ema(prix2 > prix2[1] ? prix2/prix2[1] : 0, per)
c = (prix2/prix2[1])/(prix2/prix2[1] + b)
d = 2*((prix2/prix2[1])/(prix2/prix2[1] + c*a)) - 1

plot(scaleMinimax(d, mmx, -1, 1), color=color.orange, transp=0)