概述
该策略是一种基于RSI(相对强弱指标)的短线交易策略。它利用RSI指标识别市场的潜在强弱状态,从而辅助交易决策。
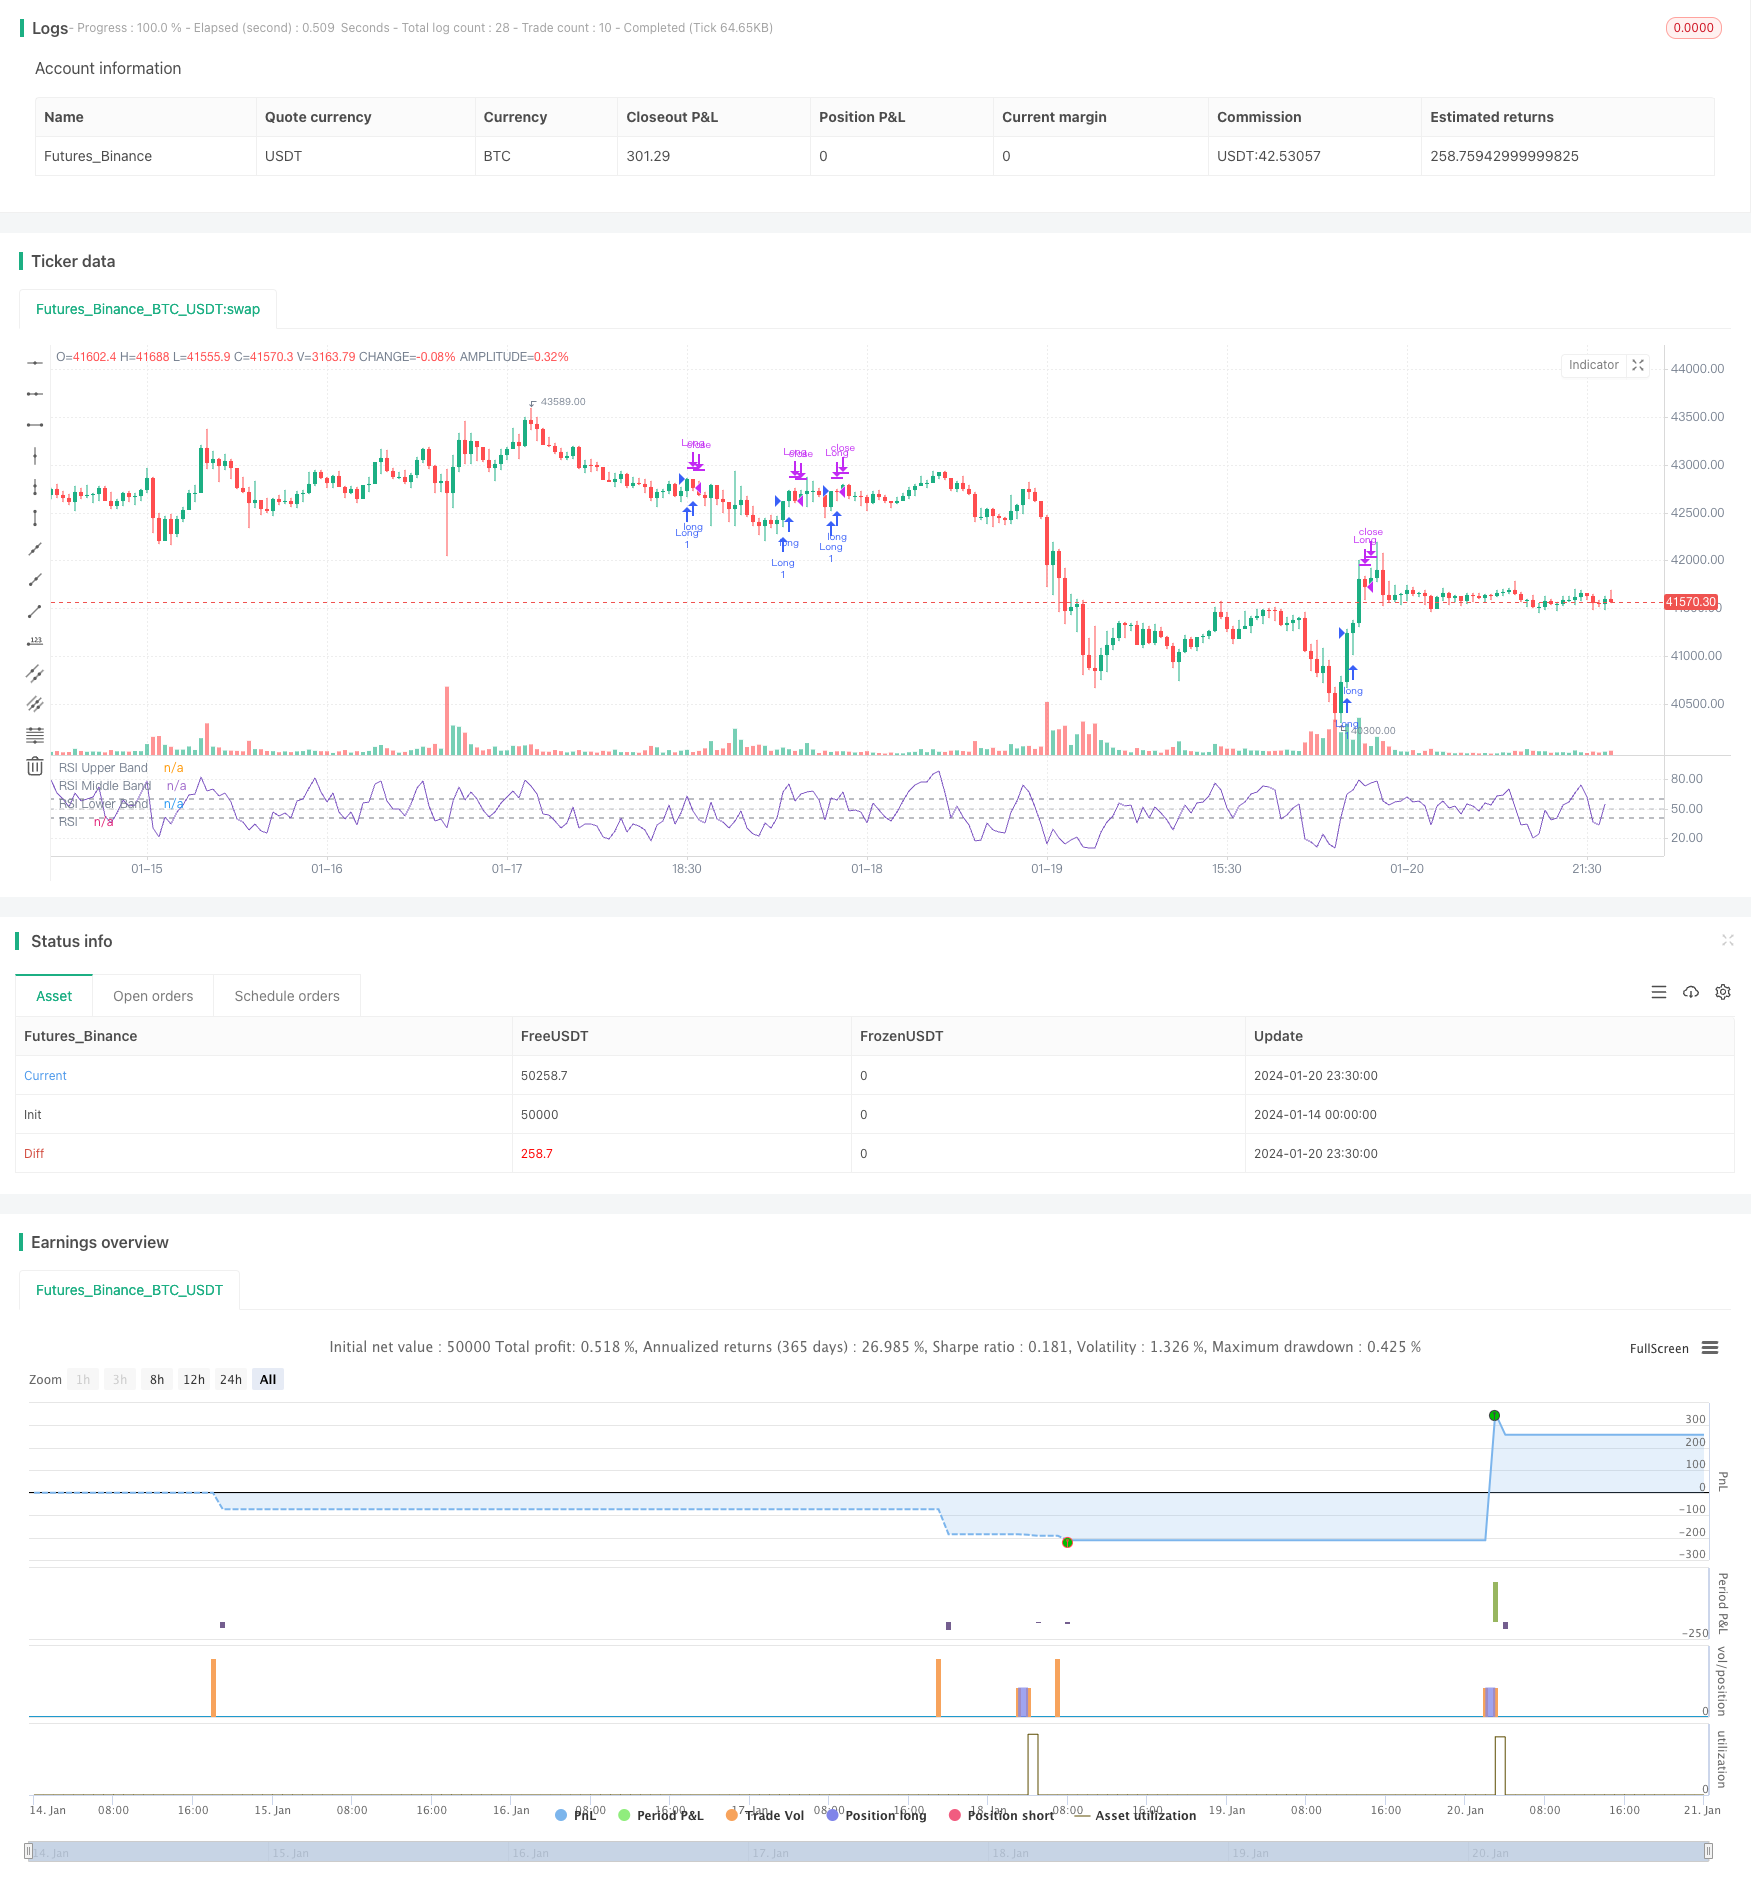
该策略使用5周期的RSI指标来捕捉短线价格动量。它根据RSI曲线的高点和低点来判断入场和止损的时机。
策略原理
进入多头头寸的条件是:前一根K线的RSI值低于50;当前K线的RSI值高于60。
平仓条件是:当RSI曲线出现更低的低点时,表示趋势转弱,此时平掉多头头寸。
优势分析
- 使用RSI指标可以有效识别市场中价格的反转点。RSI高低点的组合拐点具有很强的指示作用。
- 5周期RSI能够捕捉到短线价格的快速变动,适合短线交易。
- 策略决策规则清晰简单,容易实施。
风险分析
- RSI指标容易产生错误信号,导致止损。
- 短线操作容易增加交易频率和滑点成本。
- 实际交易中需要合理调整参数,如RSI周期数,高低点阈值等。
优化方法: - 结合其他指标过滤信号,降低误差率。比如MACD,KD等。 - 适当放宽止损线,避免过于敏感。 - 调整RSI参数,寻找最优参数组合。
总结
该策略利用RSI指标的高低点反转特征,设定了明确的多头进入和止损规则。简单实用的交易思路,但也存在一定的不稳定性。可以通过参数优化和指标组合来提高策略稳定性。
策略源码
/*backtest
start: 2024-01-14 00:00:00
end: 2024-01-21 00:00:00
period: 30m
basePeriod: 15m
exchanges: [{"eid":"Futures_Binance","currency":"BTC_USDT"}]
*/

//@version=5
strategy("*RSI 5 - Long only- Daily charts & above*", overlay = false)

// Define inputs
rsi_length = input(5, "RSI Length")

// Calculate indicators
rsi = ta.rsi(close, rsi_length)

// Entry conditions
long = rsi[1] < 50 and rsi > 60

// Exit conditions
longExit = rsi < rsi[1]


// Execute trade with adjusted position size
if (long)
    strategy.entry("Long", strategy.long)


if  (longExit)
	strategy.close("LongExit")


// Close long position if long exit condition is met
if (longExit)
    strategy.close("Long", comment="Long exit")

rsiPlot = plot(rsi, "RSI", color=#7E57C2)
rsiUpperBand = hline(60, "RSI Upper Band", color=#787B86)
midline = hline(50, "RSI Middle Band", color=color.new(#787B86, 50))
rsiLowerBand = hline(40, "RSI Lower Band", color=#787B86)
fill(rsiUpperBand, rsiLowerBand, color=color.rgb(126, 87, 194, 90), title="RSI Background Fill")