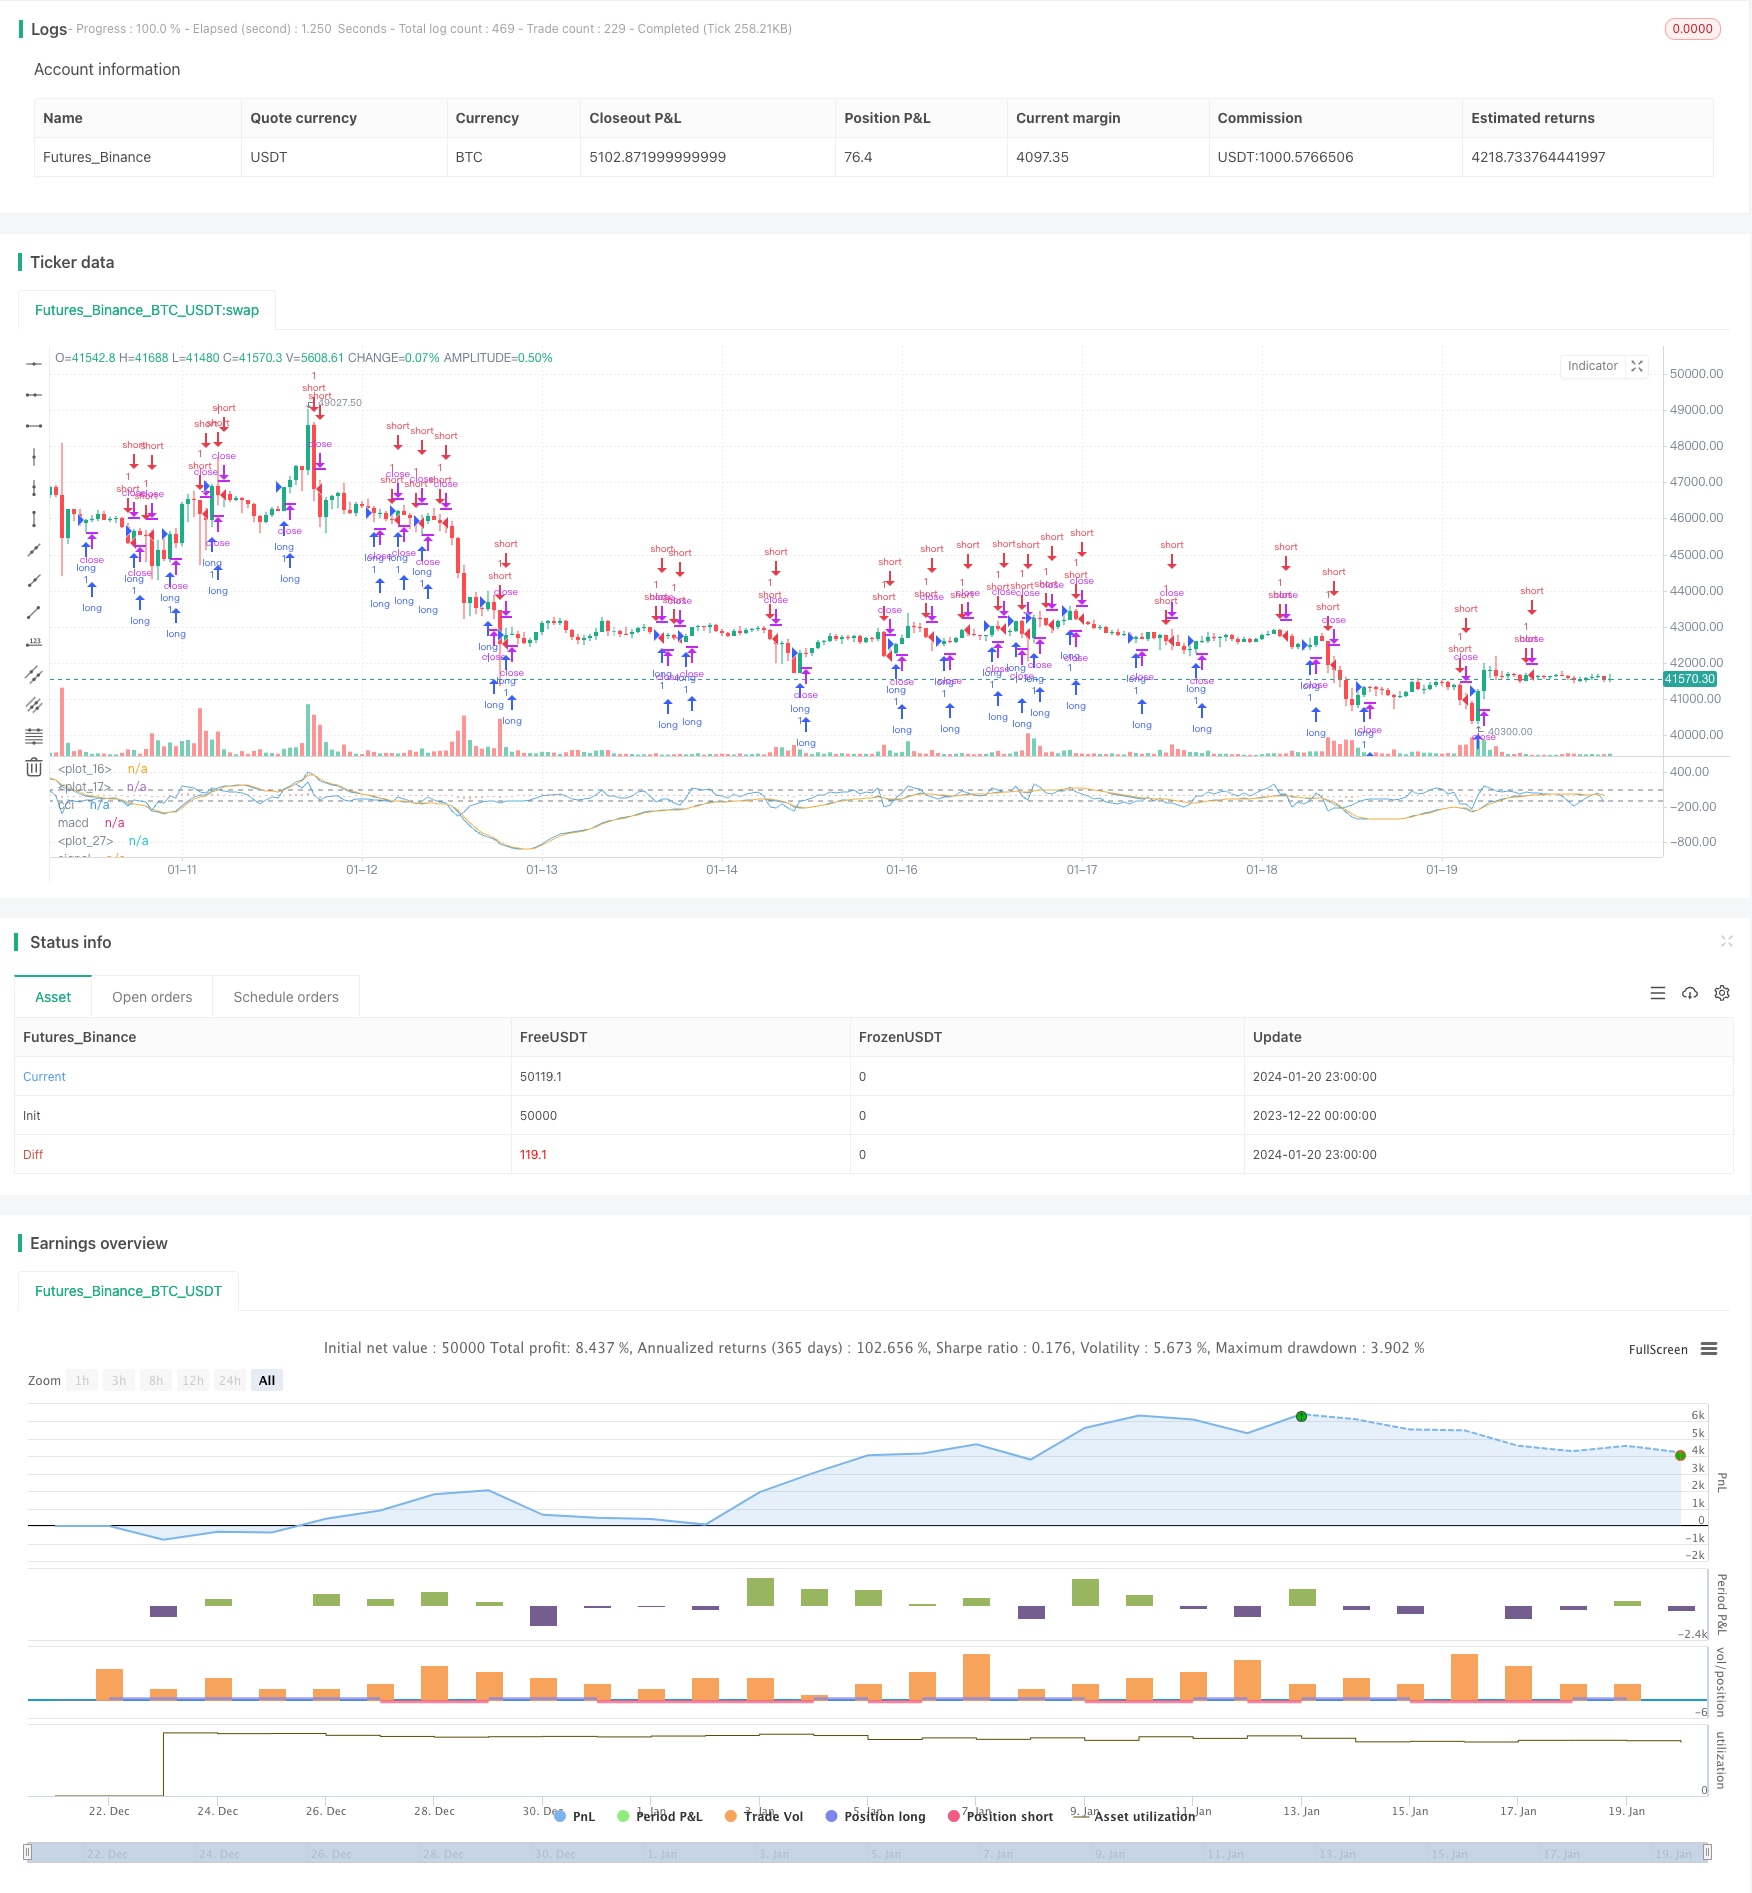
概述
本策略名为RSI指标结合CCI指标的量化交易策略。该策略主要利用RSI指标和CCI指标的组合来判断市场的超买超卖现象,以捕捉反转机会。具体来说,策略通过计算RSI的多空线,结合CCI指标的多空信号,设定多头和空头的开仓规则。当符合开仓规则时,进行相应的做多做空操作。
策略原理
本策略的核心逻辑是同时利用RSI指标和CCI指标的统计特性,判断市场目前是否处于超买或超卖状态。
首先,RSI部分。RSI指标可以反映市场的超买超卖现象。RSI大于70时为超买区,小于30时为超卖区。本策略设置长线和短线两个RSI指标,长线参数为默认14周期,短线参数为12周期。长线可以判断核心趋势,短线则可以追踪更敏感的转折点。当长线和短线的RSI指标同向(如双超买或双超卖)时,代表市场正处于明确的非均衡状态,这时就是最佳的反转机会。
其次,CCI部分。CCI指标也可以用来判断超买超卖,参数为14周期。CCI高于100为超买,低于-100为超卖。本策略利用CCI指标的这个特性,设定开仓规则:当CCI指标与RSI指标给出的多空信号一致时,即执行RSI指标判定的开仓方向。
具体来说,策略的开仓规则为:
多头开仓:当RSI指标显示超卖区(该周期内长短线RSI均小于30),并且CCI指标小于-100时,做多;
空头开仓:当RSI指标显示超买区(该周期内长短线RSI均大于70),并且CCI指标高于100时,做空。
通过RSI指标和CCI指标的共同判断,可以有效确认真正的超买超卖区间,从而提高策略的稳定性和盈利概率。
优势分析
本策略最大的优势在于同时利用RSI和CCI两个指标的统计规律,使得识别超买超卖现象更为准确,从而为捕捉反转提供了理想的切入点。具体优势如下:
- RSI的长短线结合,可以同时判断趋势和敏感反转点,灵活捕捉机会。
- CCI指标的辅助判断,避免受到市场假反转的误导。
- 通过RSI和CCI的组合判断,可以有效过滤假信号,使得入场时间点选择更加准确。
- 利用超买超卖区间进行反转交易,这本身就是一个概率较大的交易策略思路。
- 策略方法简单,容易理解和实现,适合量化初学者学习。
风险分析
本策略的主要风险在于,RSI和CCI所判断的超买超卖信号不一定能完全反映真实的反转时点。具体风险包括:
- 指标发出的信号可能是假反转。如价格出现震荡调整而不是趋势反转。
- 即使判断正确也会有时间滞后。计算周期内的参数变化不能完全同步反映最新价格变动。
- 反转过程中,止损点可能被突破而导致亏损扩大。
- 策略没有考虑大级别趋势的影响,在具体实施中需要结合趋势分析。
对应风险的解决方法包括:
- 确认反转信号放量突破效果更佳。如价格在指标反转信号出现时有大量放量上涨,则可增加判断的可靠性。
- 适当调整RSI和CCI的参数,降低滞后现象的概率。
- 做好止损和离场思路,控制单笔亏损。
- 在具体实施策略时,要辅以趋势和形态分析,避免逆势操作。
优化方向
本策略在实际运行中还可进一步优化,主要优化思路包括:
- 测试RSI和CCI的参数设置,找到最优参数组合。如测试RSI的长短周期参数,和CCI周期参数。
- 增加别的指标以丰富多空判断依据,如KD,MACD等。
- 增加止损策略。如设置移动止损,或之字止损。
- 结合高级制胜策略,利用指标分歧来确定胜率更高的入场方向等。
- 利用机器学习算法自动优化参数和信号权重。
- 测试该策略与趋势系统的组合策略。
- 增加对大级别趋势和重要价格位的判断规则。避免逆势操作。
通过测试和优化,可以期望本策略的盈利能力和稳定性得到进一步提高。
总结
本策略属于较为典型的反转捕捉策略。通过RSI和CCI两个常用指标的结合,判断超买超卖区间,并设计相应的开仓规则,形成了一个简单实用的短线交易策略。该策略主要优势是指标组合使用使判断更准确,避免假反转的误导,从而把握反转的最佳时机。当然风险也存在,需要做好指标优化,止损策略,与趋势判断的配合使用。总体来说,本策略为初学者提供了一个简单可靠的量化方法,值得学习和实践。
/*backtest
start: 2023-12-22 00:00:00
end: 2024-01-21 00:00:00
period: 1h
basePeriod: 15m
exchanges: [{"eid":"Futures_Binance","currency":"BTC_USDT"}]
*/

//@version=3
//Author: RvZ14
//Based on Joseph Nemeth MACD+CCI strategy
//Reference reading: https://sites.google.com/site/forexjosephnemeth/home/macd-cci

strategy(title="MACD+CCI Strategy", shorttitle="macd/cci")
length = input(14, minval=1)
fastLength = input(12, minval=1), slowLength=input(26,minval=1)
signalLength=input(2,minval=1)
src = input(close, title="CCI Source")

//cci
ma = sma(src, length)
cci = (src - ma) / (0.015 * dev(src, length))
plot(cci, title = "cci", color=#5DADE2,linewidth = 1,transp = 0)
band1 = hline(100, color=gray, linewidth = 1)
band0 = hline(-100, color=gray, linewidth = 1)
fill(band1, band0, color= #F9E79F)

//macd
source = close
fastMA = ema(source, fastLength)
slowMA = ema(source, slowLength)
macd = fastMA - slowMA
signal = ema(macd, signalLength)
hist = macd - signal
plot(hist, color=#EC7063, style=histogram)
plot(macd, title = "macd", color=#5DADE2, linewidth = 1,transp = 0)
plot(signal, title = "signal", color=#F5B041,linewidth = 1,transp = 0)

longCond = cci > 100 and macd > 0 or cci > -100 and macd < 0
shortCond = cci < -100 and macd < 0 or cci < 100 and macd > 0
strategy.entry("long",strategy.long,when = longCond == true)
strategy.entry("short",strategy.short,when=shortCond == true)