概述
该策略是基于布林带通道的回归突破策略。当价格跌破布林带通道下轨时,进行长仓入场。止损价格设为入场突破点的最低价。止盈目标为布林带上轨。
策略原理
该策略使用20周期的布林带通道。布林带通道由中轨、上轨和下轨组成。中轨为20周期的简单移动平均线,上轨由中轨加上标准差的2倍构成,下轨由中轨减去标准差的2倍构成。
当价格跌破下轨时,表明价格进入了超卖状态,这时进行长仓入场。入场后,止损价格设为入场时那根K线的最低价,止盈目标为布林带上轨。这样,策略就是追逐价格从超卖状态回归均线的过程,实现盈利。
策略优势分析
该策略具有以下优势:
- 利用布林带通道判断市场超买超卖状态,具有一定的时效性
- 回归交易策略,避免docname追高杀跌
- 止盈止损点设置合理,有利于风险控制
风险分析
该策略也存在一些风险:
- 布林带并不能完美判断价格趋势,价格突破下轨不一定会反弹
- 大盘持续下跌时, Floating P/L 可能首先触发止损
- 止盈点靠近上轨,存在止盈成本过高风险
策略优化方向
该策略可以从以下几个方面进行优化:
- 优化布林带参数,寻找最佳参数组合
- 添加其他指标过滤信号,提高入场准确率
- 优化止盈止损策略,提高盈亏比
总结
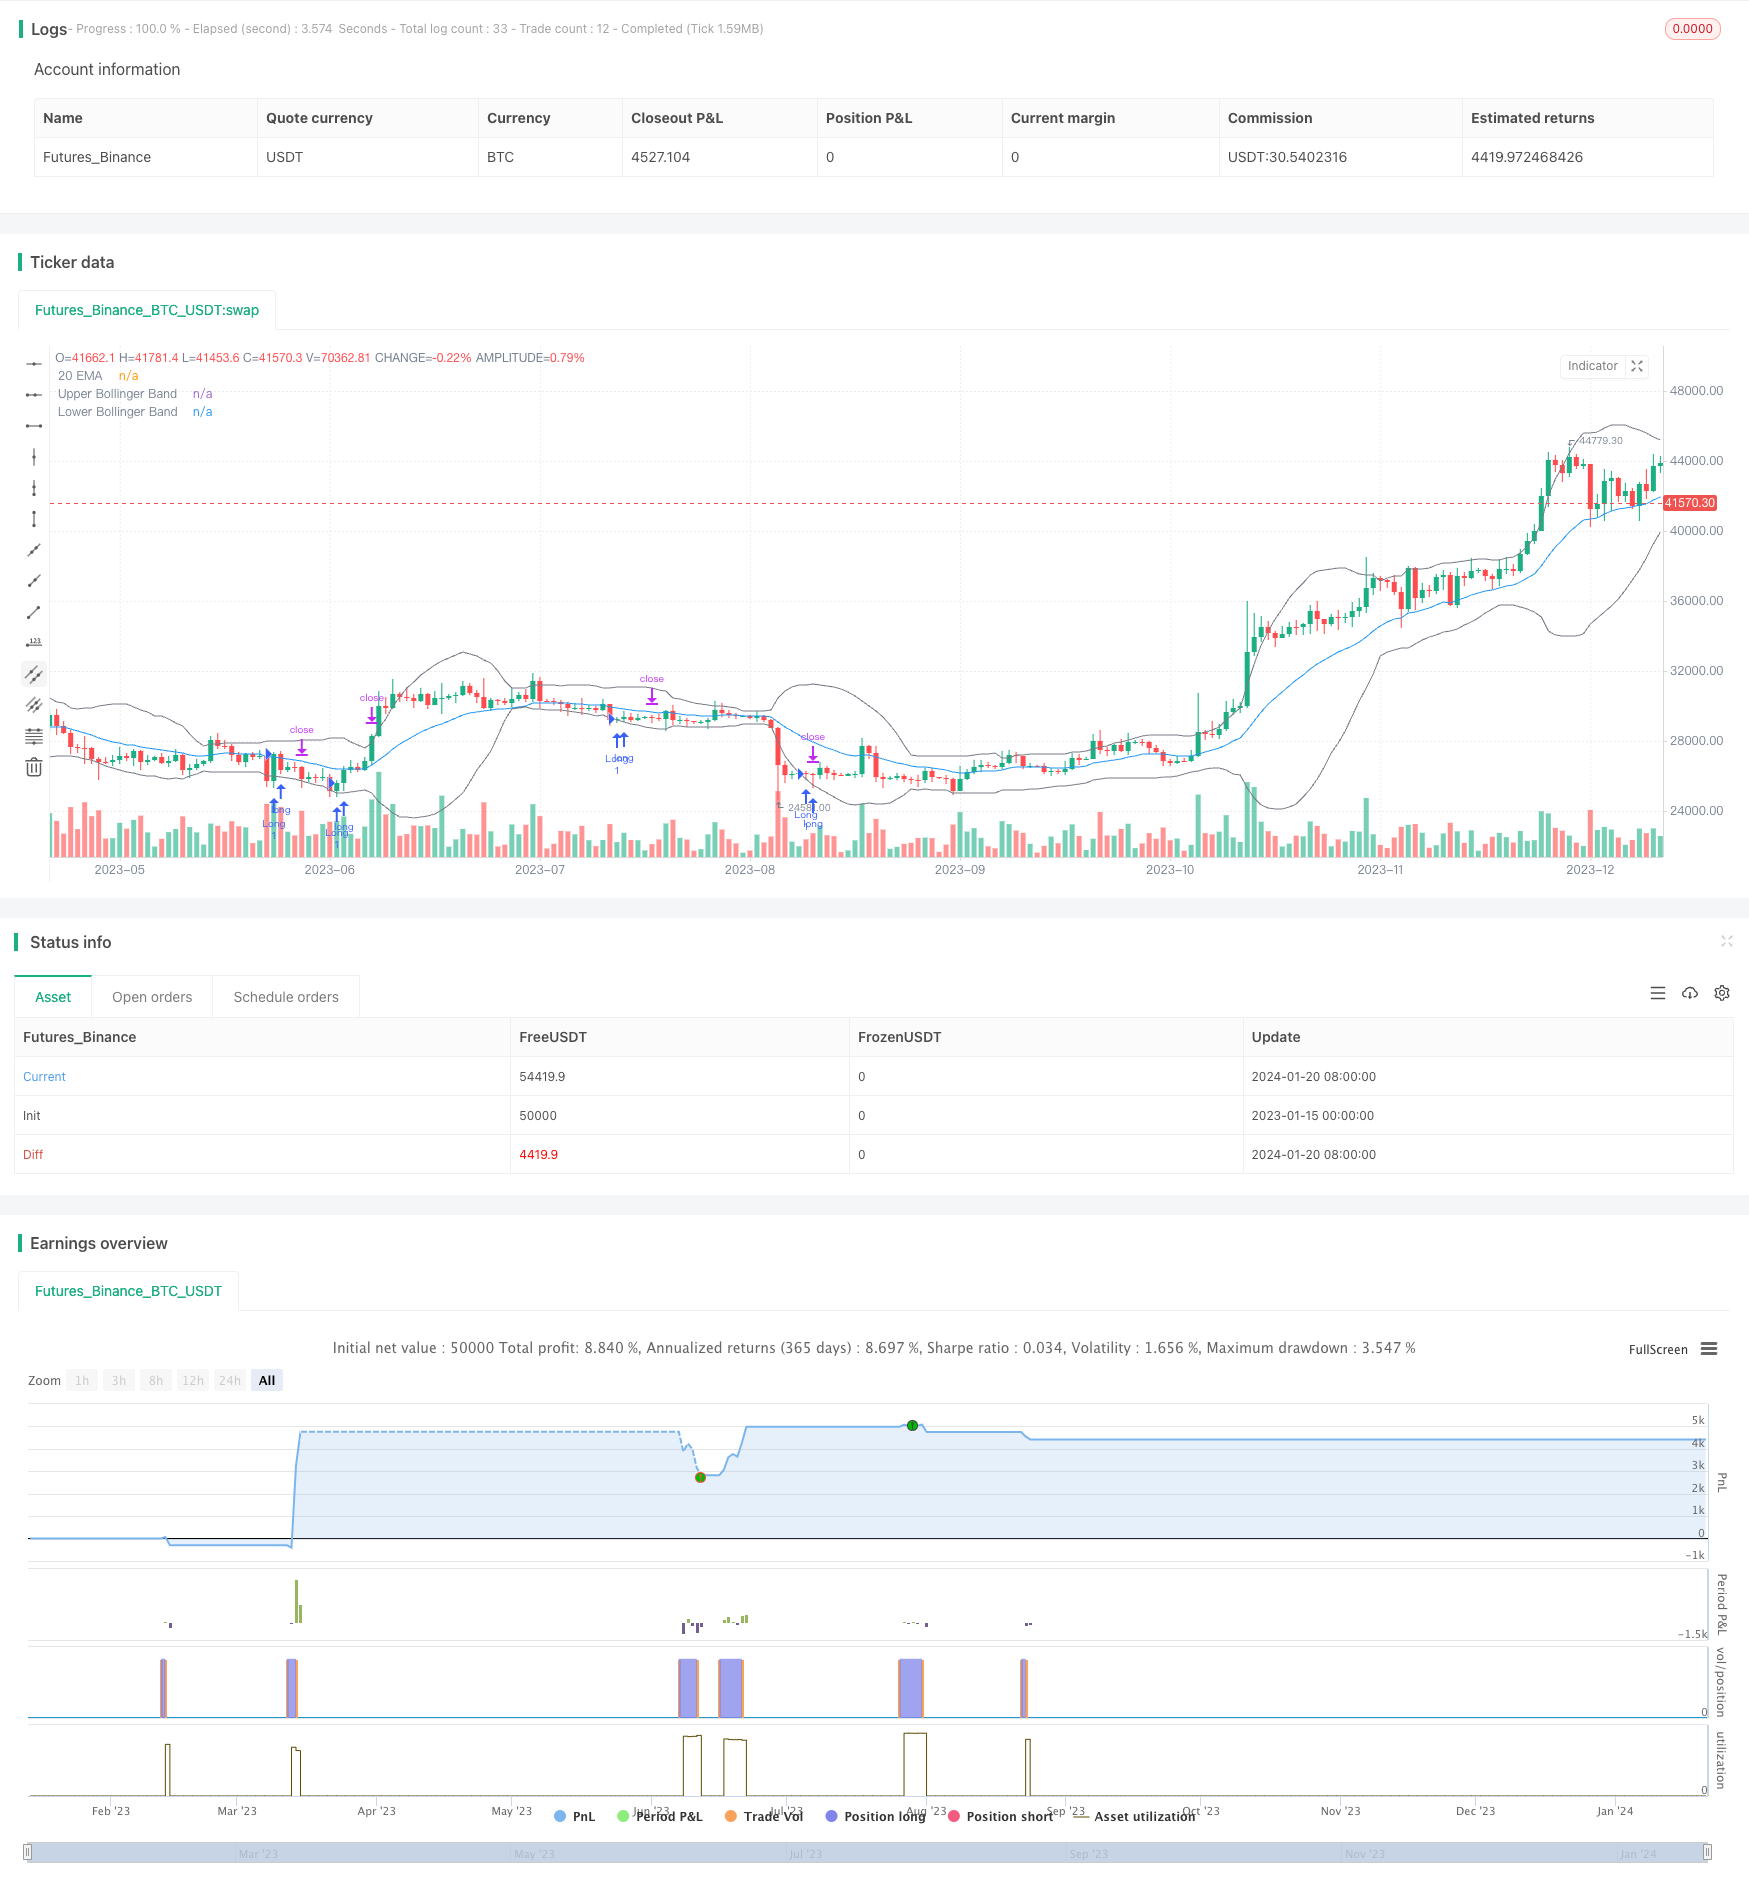
该策略整体思路清晰,具有一定的操作性。但其利用布林带判断超买超卖的时效性并不高,无法完美判断价格趋势。此外,止盈止损机制也有待优化。后续可从选择更准确指标、优化参数以及改进止盈止损机制等方面进行优化,提升策略profitability。
策略源码
/*backtest
start: 2023-01-15 00:00:00
end: 2024-01-21 00:00:00
period: 1d
basePeriod: 1h
exchanges: [{"eid":"Futures_Binance","currency":"BTC_USDT"}]
*/

// This source code is subject to the terms of the Mozilla Public License 2.0 at https://mozilla.org/MPL/2.0/
// © Ronsword
//@version=5

strategy("bb 2ND target", overlay=true)

// STEP 1. Create inputs that configure the backtest's date range
useDateFilter = input.bool(true, title="Filter Date Range of Backtest",
     group="Backtest Time Period")
backtestStartDate = input(timestamp("1 Jan 1997"),
     title="Start Date", group="Backtest Time Period",
     tooltip="This start date is in the time zone of the exchange " +
     "where the chart's instrument trades. It doesn't use the time " +
     "zone of the chart or of your computer.")
backtestEndDate = input(timestamp("1 Sept 2023"),
     title="End Date", group="Backtest Time Period",
     tooltip="This end date is in the time zone of the exchange " +
     "where the chart's instrument trades. It doesn't use the time " +
     "zone of the chart or of your computer.")

// STEP 2. See if the current bar falls inside the date range
inTradeWindow = true

// Bollinger Bands inputs
length = input.int(20, title="Bollinger Bands Length")
mult = input.float(2.0, title="Multiplier")
src = input(close, title="Source")
basis = ta.sma(src, length)
dev = mult * ta.stdev(src, length)
upper = basis + dev
lower = basis - dev

// EMA Settings
ema20 = ta.ema(close, 20)
plot(ema20, color=color.blue, title="20 EMA")

// Entry condition
longEntryCondition = ta.crossover(close, lower)

// Define stop loss level as the low of the entry bar
var float stopLossPrice = na
if longEntryCondition
    stopLossPrice := low

// Top Bollinger Band itself is set as the target
topBandTarget = upper

// Enter long position when conditions are met
if inTradeWindow and longEntryCondition
    strategy.entry("Long", strategy.long, qty=1)

// Set profit targets
strategy.exit("ProfitTarget2", from_entry="Long", limit=topBandTarget)

// Set stop loss
strategy.exit("StopLoss", stop=stopLossPrice)

// Plot Bollinger Bands with the same gray color
plot(upper, color=color.gray, title="Upper Bollinger Band")
plot(lower, color=color.gray, title="Lower Bollinger Band")