概述
本策略通过计算快线EMA和慢线EMA的交叉情况,实现黄金交叉和死亡交叉交易信号的生成。当快线EMA上穿慢线EMA时,产生买入信号;当快线EMA下穿慢线EMA时,产生卖出信号。该策略充分利用了移动平均线的优势,能够有效跟踪市场趋势,在趋势启动阶段产生交易信号。
策略原理
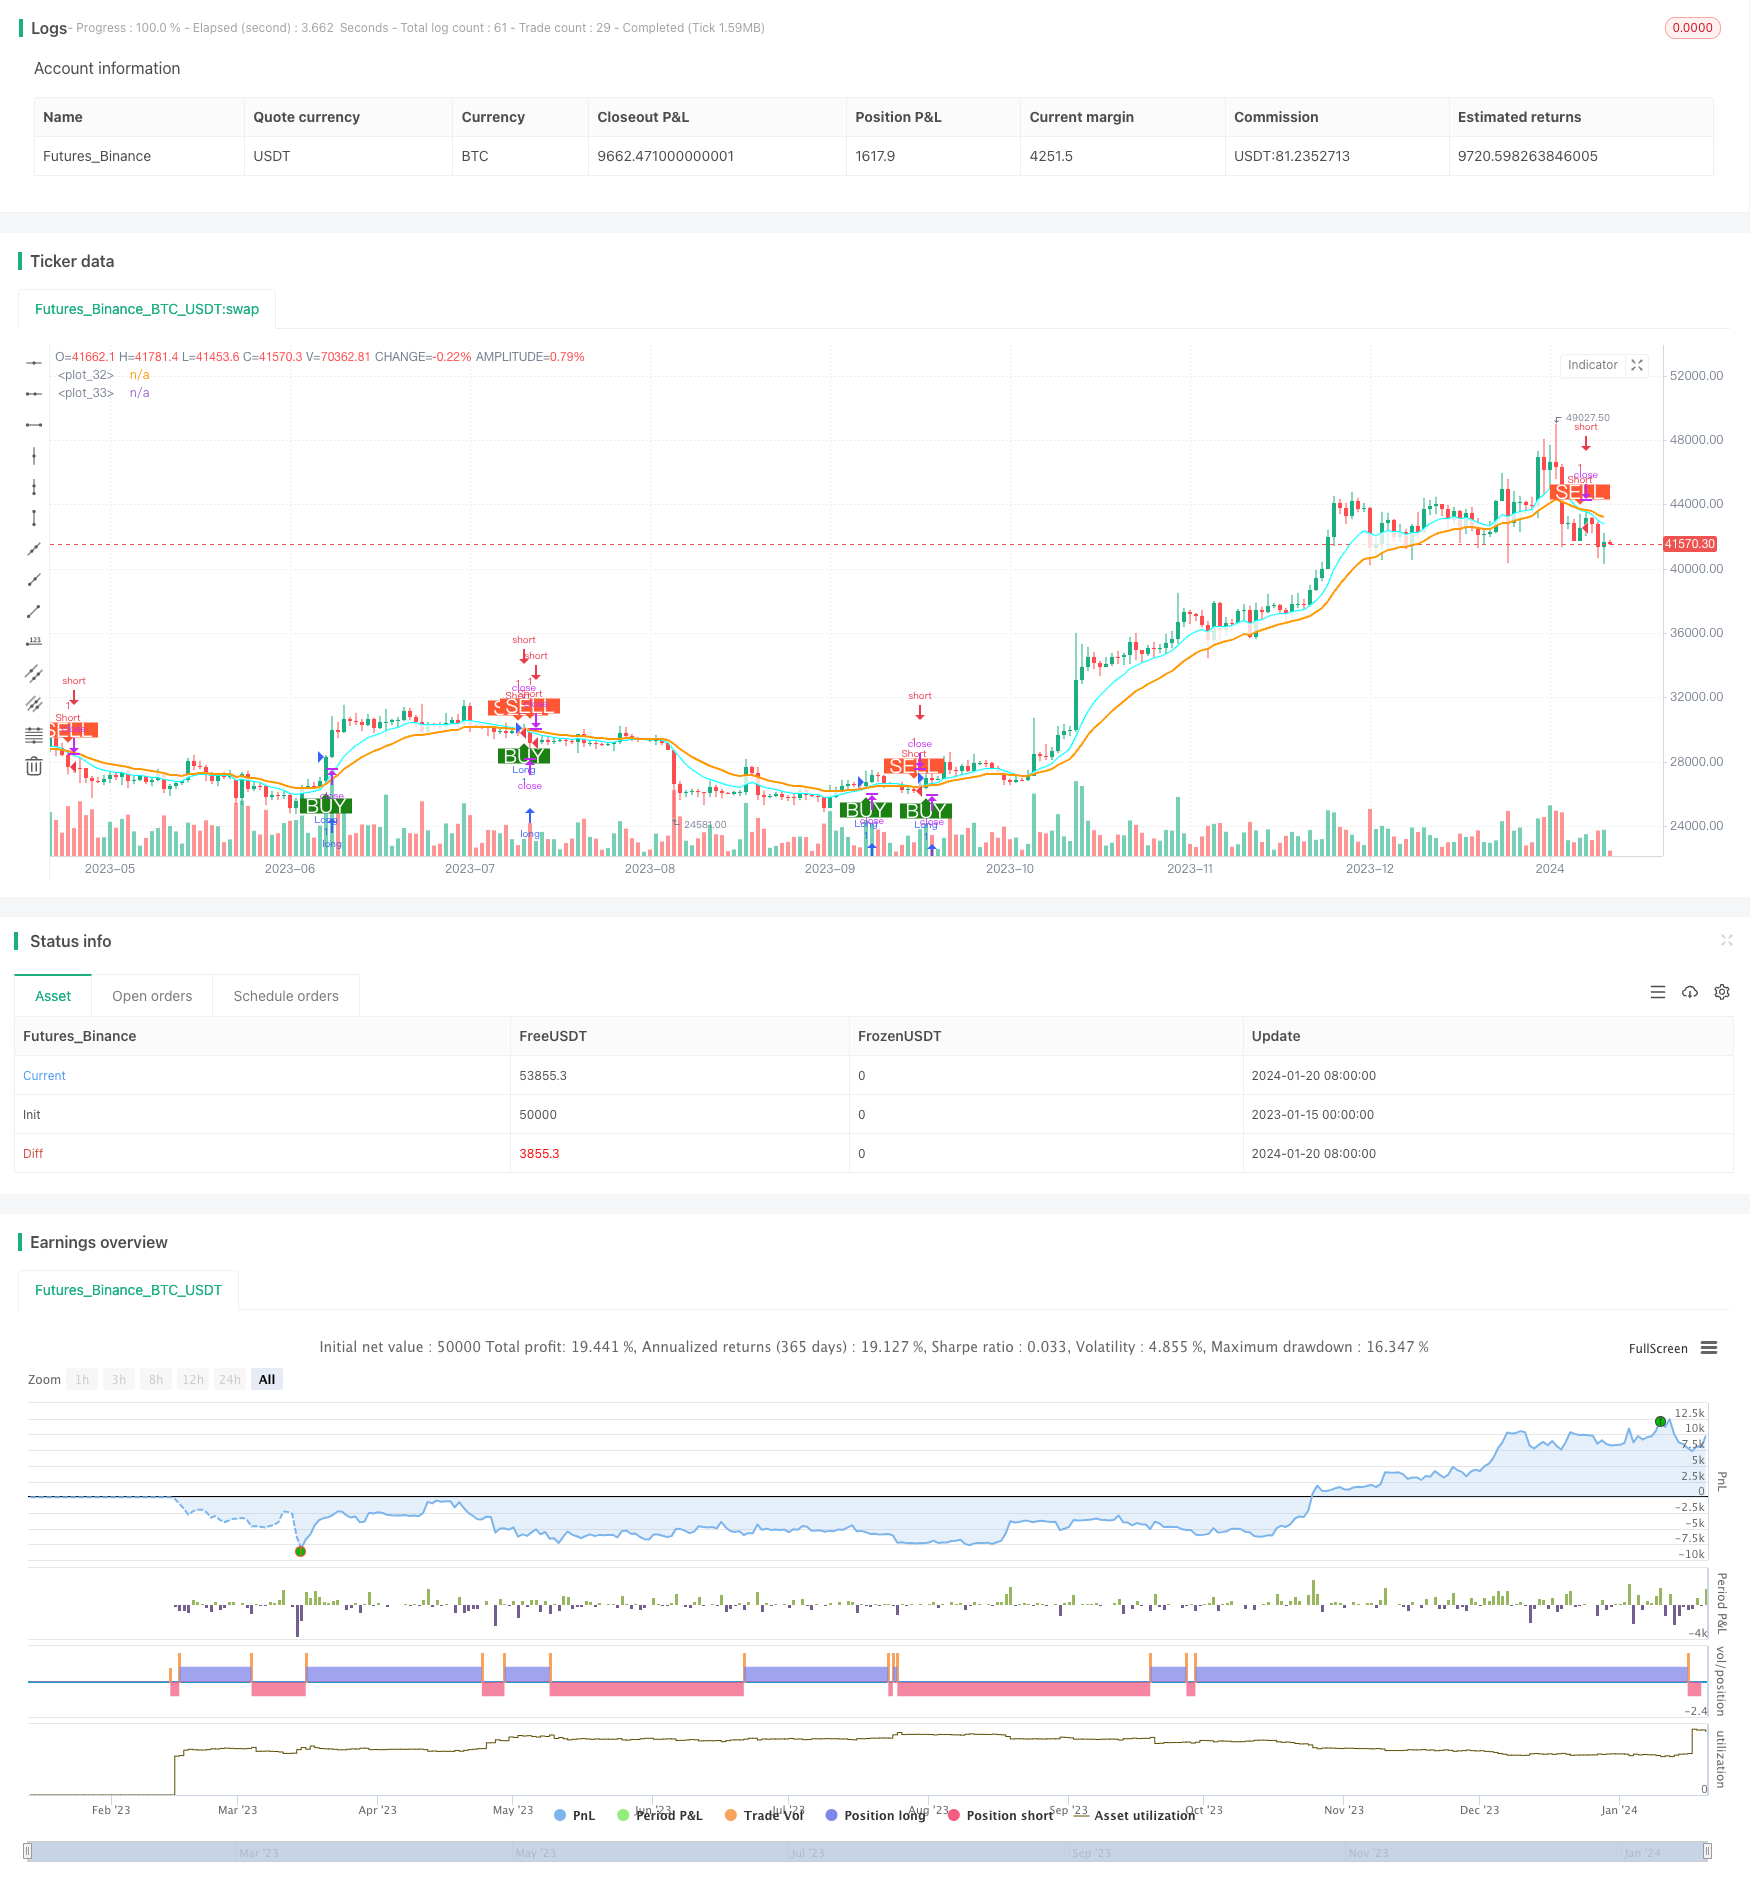
本策略的核心指标是快速EMA线和慢速EMA线。策略通过设置两个不同参数的EMA线,快线EMA参数设置为10,慢线EMA参数设置为20。其中,10日EMA线能更快速地响应价格变动,而20日线响应速度较慢。当短期EMA线上穿长期EMA线时,代表短期平均线开始引领长期平均线向上,说明行情可能进入看涨状态,此时产生买入信号;相反,当短期平均线下穿长期平均线时,代表短期均线开始失去对长期均线的领先优势,说明行情可能进入看跌状态,此时产生卖出信号。
通过快慢EMA线的交叉原理,本策略充分捕捉到市场趋势的转换时机,能够及时产生交易信号。同时,EMA指标本身具有滤波假信号的能力,避免在市场震荡时频繁开仓。这使得该策略能够在减少错误交易的同时,捕捉市场转折点,具有较高的盈利能力。
优势分析
- 利用EMA交叉原理,捕捉市场转折点,盈利能力较强
- 快速EMA线和慢速EMA线配合使用,发挥各自优势
- EMA本身具有滤波作用,可以减少错误交易
- 实现简单,容易理解和优化
- 可扩展性强,可引入其他辅助指标进一步优化
风险分析
- 双EMA交叉在震荡市中可能产生频繁错误信号
- EMA参数设置不当可能错过市场转折点
- 存在一定的滞后,可能错过短线操作机会
- 无法应对剧烈行情的突变
针对上述风险,可以通过引入附加指标进行优化,例如增大交易过滤条件,结合MACD指标避免错误信号,使用自适应EMA加速指标响应速度等。此外,合理止损和积极止盈也是必要的。
优化方向
本策略可进一步优化的方向包括:
- 增加开仓过滤:比如结合交易量指标,避免低量假突破
- 结合MACD等辅助指标,进一步避免错误信号
- 引入自适应EMA,根据市场情况动态调整EMA参数
- 多时间框架联合操作,发挥不同周期EMA的优势
- 优化止损策略,通过移动止损、比率止损等方式锁定利润
- 结合深度学习等技术实现参数自动优化
总结
本策略通过双EMA快慢线交叉原理,捕捉市场关键转折点,具有较强的实盘效果。配合辅助指标和优化止损,可以进一步增强策略稳定性。该策略思路简单清晰,值得量化交易者学习和运用,也有很大的拓展空间和优化潜力。
策略源码
/*backtest
start: 2023-01-15 00:00:00
end: 2024-01-21 00:00:00
period: 1d
basePeriod: 1h
exchanges: [{"eid":"Futures_Binance","currency":"BTC_USDT"}]
*/

//@version=4
strategy("Backtest single EMA cross", overlay=true)

qty = input(100000, "Buy quantity")

testStartYear = input(2019, "Backtest Start Year")
testStartMonth = input(1, "Backtest Start Month")
testStartDay = input(1, "Backtest Start Day")
testStartHour = input(0, "Backtest Start Hour")
testStartMin = input(0, "Backtest Start Minute")
testPeriodStart = timestamp(testStartYear, testStartMonth, testStartDay, testStartHour, testStartMin)
testStopYear = input(2099, "Backtest Stop Year")
testStopMonth = input(1, "Backtest Stop Month")
testStopDay = input(30, "Backtest Stop Day")
testPeriodStop = timestamp(testStopYear, testStopMonth, testStopDay, 0, 0)
testPeriodBackground = input(title="Color Background?", type=input.bool, defval=true)
testPeriodBackgroundColor = testPeriodBackground and time >= testPeriodStart and time <= testPeriodStop ?
   #00FF00 : na
testPeriod() => true


ema1 = input(10, title="Select EMA 1")
ema2 = input(20, title="Select EMA 2")

expo = ema(close, ema1)
ma = ema(close, ema2)

avg_1 = avg(expo, ma)
s2 = cross(expo, ma) ? avg_1 : na
//plot(s2, style=plot.style_line, linewidth=3, color=color.red, transp=0)

p1 = plot(expo, color=#00FFFF, linewidth=2, transp=0)
p2 = plot(ma, color=color.orange, linewidth=2, transp=0)
fill(p1, p2, color=color.white, transp=80)

longCondition = crossover(expo, ma)

shortCondition = crossunder(expo, ma)


if testPeriod()
    strategy.entry("Long", strategy.long, when=longCondition)
    strategy.entry("Short", strategy.short, when=shortCondition)

plotshape(longCondition, title = "Buy Signal", text ="BUY", textcolor =#FFFFFF , style=shape.labelup, size = size.normal, location=location.belowbar, color = #1B8112, transp = 0)
plotshape(shortCondition, title = "Sell Signal", text ="SELL", textcolor = #FFFFFF, style=shape.labeldown, size = size.normal, location=location.abovebar, color = #FF5733, transp = 0)