概述
本策略综合运用IMACD、EMA和一目均衡表等多种技术指标,构建一个全面的决策树模型,用于发出买入和卖出信号。
策略原理
- IMACD:增强型MACD,通过ImpulseMACD和ImpulseHisto更好地捕捉市场趋势
- 一目均衡表:绘制换手线、基准线、先行线A、先行线B等,检测支撑和阻力位
- EMA 40:辅助判断趋势方向
- 根据IMACD、云图组件和EMA 40的具体关系,发出做多和做空信号
做多信号:当IMACD为特定条件颜色且EMA 40高于云图的上轨时,做多
做空信号:当IMACD为红色且EMA 40低于云图的下轨时,做空
优势分析
- 多指标组合,综合判断市场趋势,提高决策的准确性
- 决策树模型分类明确,交易信号生成清晰
- EMA长度可调,辅助判断的灵活性更高
- 结合云图和趋势指标,更好地识别支撑和阻力
风险分析
- 多指标组合,参数设置较为复杂
- EMA长度设置不当,可能导致虚假交易信号
- 需同时关注多个指标,操作难度较大
风险解决:优化参数设置,调整EMA长度,简化操作流程。
优化方向
- 优化参数设置,提高策略稳定性
- 增加止损策略,控制单笔损失
- 基于巨量数据进行回测,提高信号质量
- 结合机器学习算法,建立自适应决策树
总结
本策略综合运用多种指标识别趋势,构建决策树模型产生交易信号。优点是信号质量高,准确率高,适合逐步优化。需要关注参数优化及止损策略,以控制交易风险,从而获得长期稳定回报。
策略源码
/*backtest
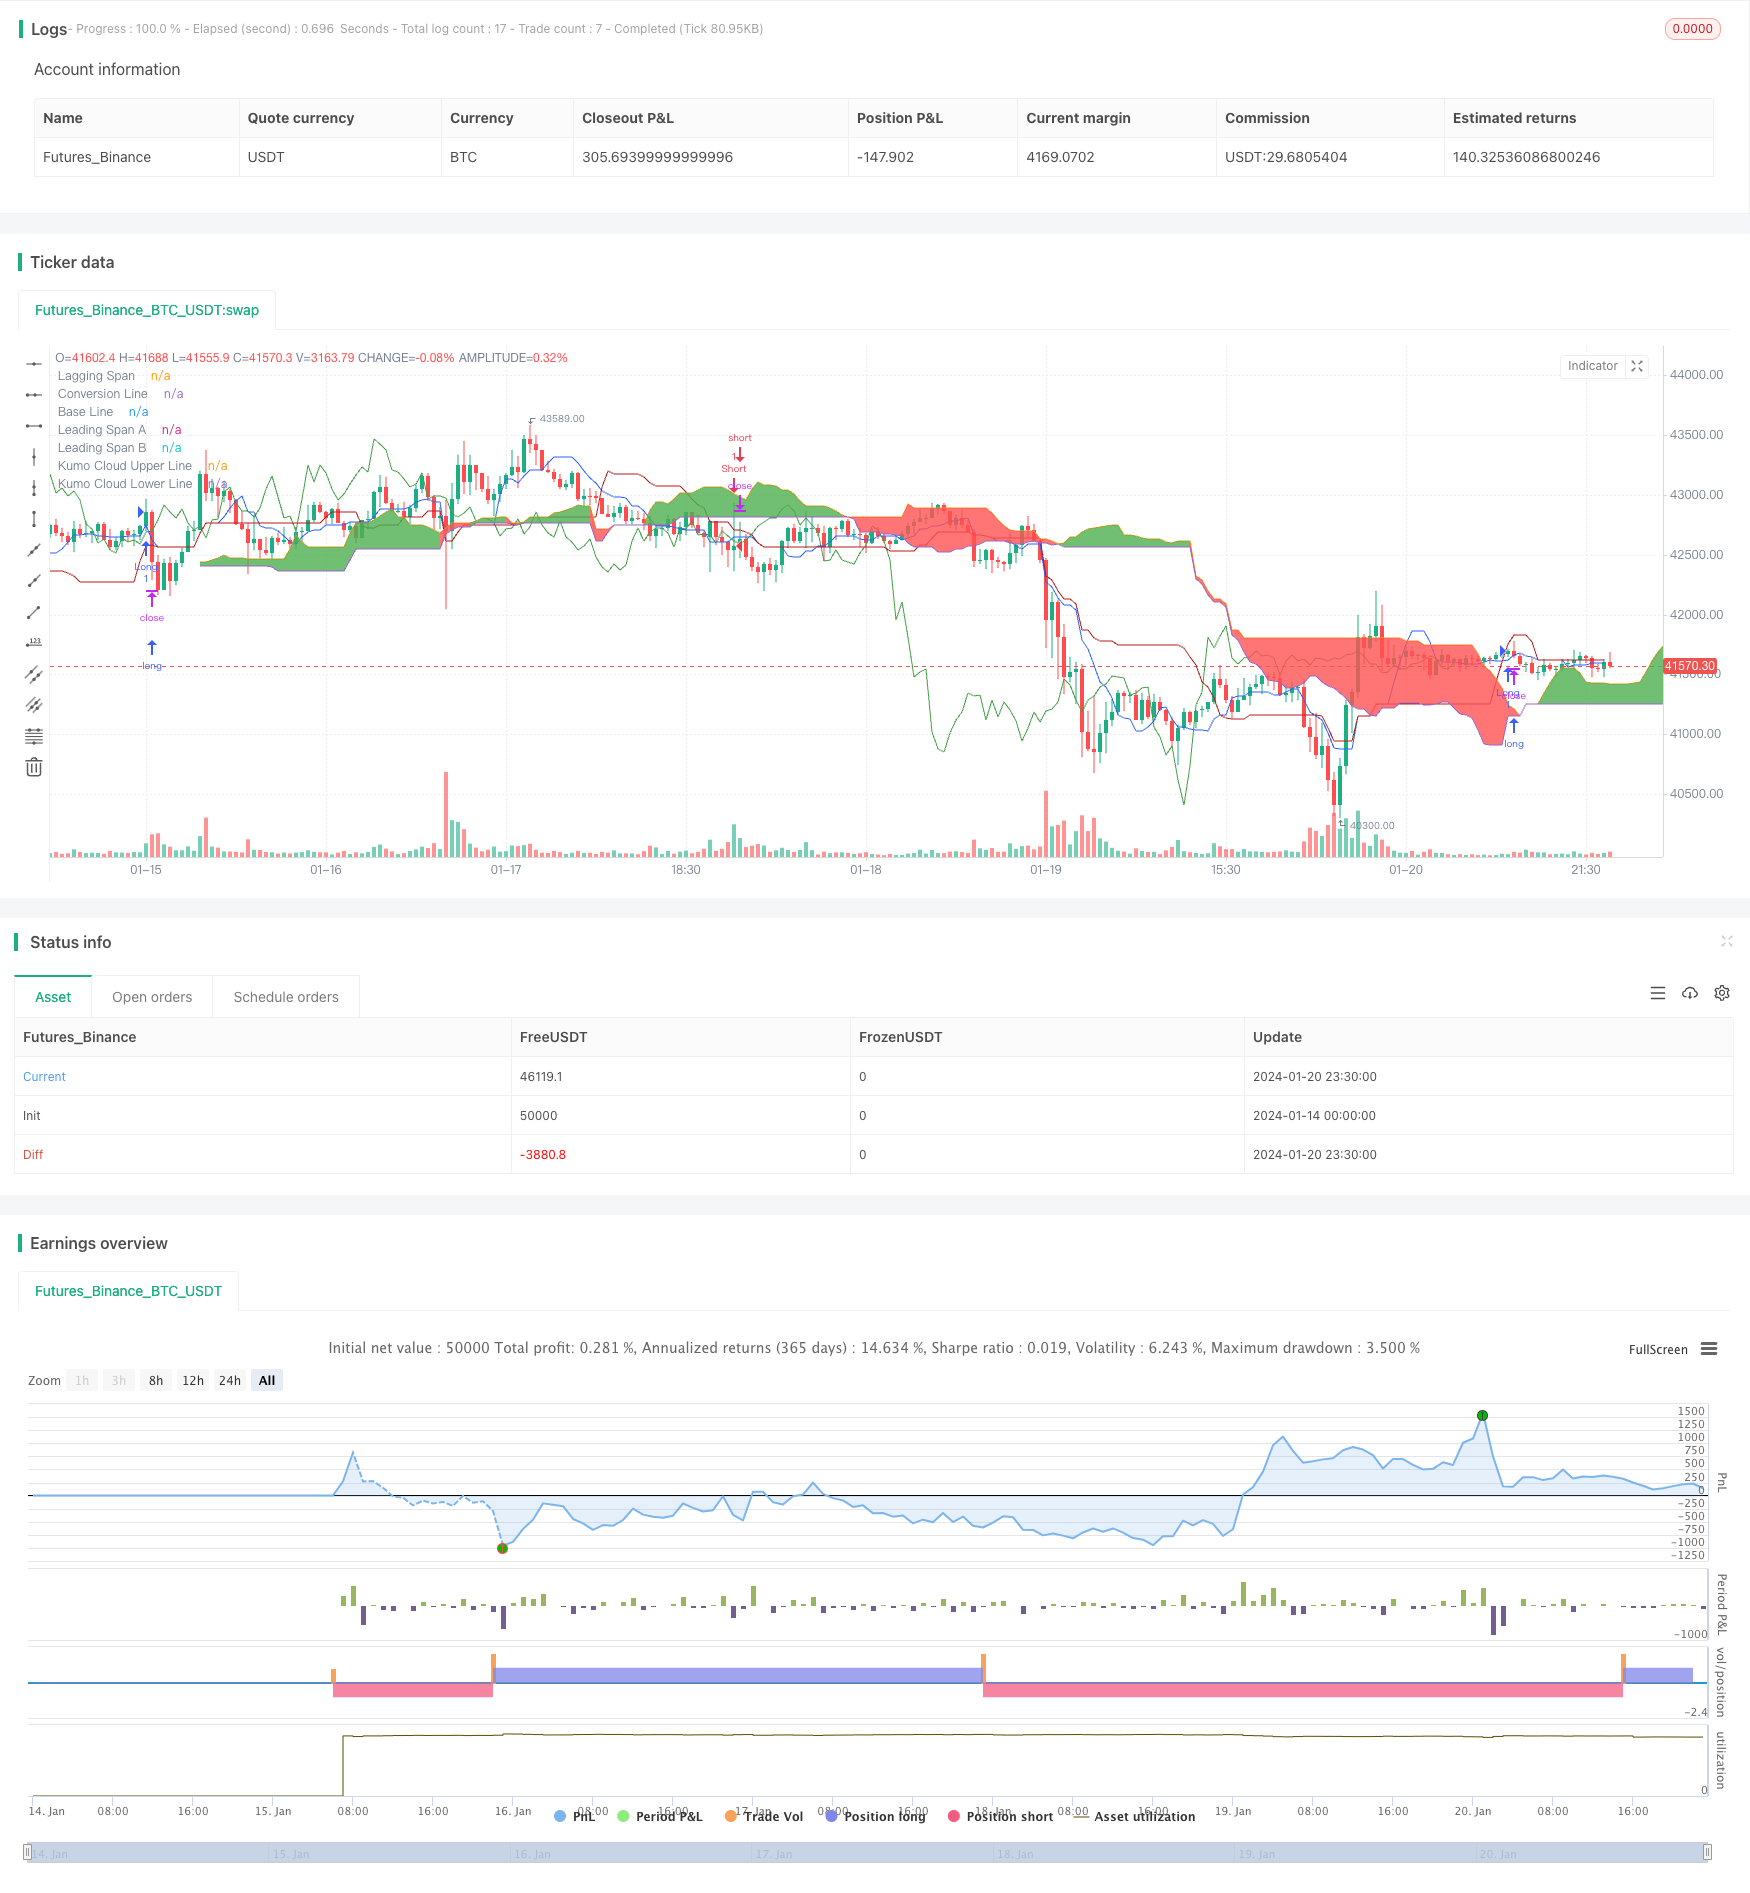
start: 2024-01-14 00:00:00
end: 2024-01-21 00:00:00
period: 30m
basePeriod: 15m
exchanges: [{"eid":"Futures_Binance","currency":"BTC_USDT"}]
*/
//@version=5
strategy("Decision Tree Strategy: IMACD, EMA and Ichimoku [cryptoonchain]", overlay=true)
lengthMA = input(34, title="Length MA")
lengthSignal = input(9, title="Length Signal")
conversionPeriods = input.int(9, minval=1, title="Conversion Line Length")
basePeriods = input.int(26, minval=1, title="Base Line Length")
laggingSpan2Periods = input.int(52, minval=1, title="Leading Span B Length")
displacement = input.int(26, minval=1, title="Lagging Span")
emaLength = input(40, title="EMA Length") // Added user-configurable EMA length
calc_smma(src, len) =>
smma = float(na)
smma := na(smma[1]) ? ta.sma(src, len) : (smma[1] * (len - 1) + src) / len
smma
calc_zlema(src, length) =>
ema1 = ta.ema(src, length)
ema2 = ta.ema(ema1, length)
d = ema1 - ema2
ema1 + d
src = ohlc4
hi = calc_smma(high, lengthMA)
lo = calc_smma(low, lengthMA)
mi = calc_zlema(src, lengthMA)
md = (mi > hi) ? (mi - hi) : (mi < lo) ? (mi - lo) : 0
sb = ta.sma(md, lengthSignal)
sh = md - sb
mdc = src > mi ? (src > hi ? color.rgb(128, 255, 0, 26) : color.green) : (src < lo ? color.red : color.orange)
colorCondition = color.rgb(128, 255, 0, 26)
conversionLine = math.avg(ta.lowest(conversionPeriods), ta.highest(conversionPeriods))
baseLine = math.avg(ta.lowest(basePeriods), ta.highest(basePeriods))
leadLine1 = math.avg(conversionLine, baseLine)
leadLine2 = math.avg(ta.lowest(laggingSpan2Periods), ta.highest(laggingSpan2Periods))
// Use user-configurable length for EMA
ema40 = ta.ema(close, emaLength)
ebc = input(false, title="Enable bar colors")
barcolor(ebc ? mdc : na)
conversionLinePlot = plot(conversionLine, color=#2962FF, title="Conversion Line", display=display.none)
baseLinePlot = plot(baseLine, color=#B71C1C, title="Base Line", display=display.none)
laggingSpanPlot = plot(close, offset=-displacement + 1, color=#43A047, title="Lagging Span", display=display.none)
leadLine1Plot = plot(leadLine1, offset=displacement - 1, color=#A5D6A7, title="Leading Span A", display=display.none)
leadLine2Plot = plot(leadLine2, offset=displacement - 1, color=#EF9A9A, title="Leading Span B", display=display.none)
kumoCloudUpperLinePlot = plot(leadLine1 > leadLine2 ? leadLine1 : leadLine2, offset=displacement - 1, title="Kumo Cloud Upper Line", display=display.none)
kumoCloudLowerLinePlot = plot(leadLine1 < leadLine2 ? leadLine1 : leadLine2, offset=displacement - 1, title="Kumo Cloud Lower Line", display=display.none)
fill(kumoCloudUpperLinePlot, kumoCloudLowerLinePlot, color=leadLine1 > leadLine2 ? color.green : color.red)
a = (leadLine1 > leadLine2 ? leadLine1 : leadLine2)
b = (leadLine1 < leadLine2 ? leadLine1 : leadLine2)
if mdc == colorCondition and ema40 > a[displacement - 1]
strategy.entry("Long", strategy.long)
if mdc == color.red and ema40 < b[displacement - 1]
strategy.entry("Short", strategy.short)