Deviation-Based Trend Tracking Strategy

Overview
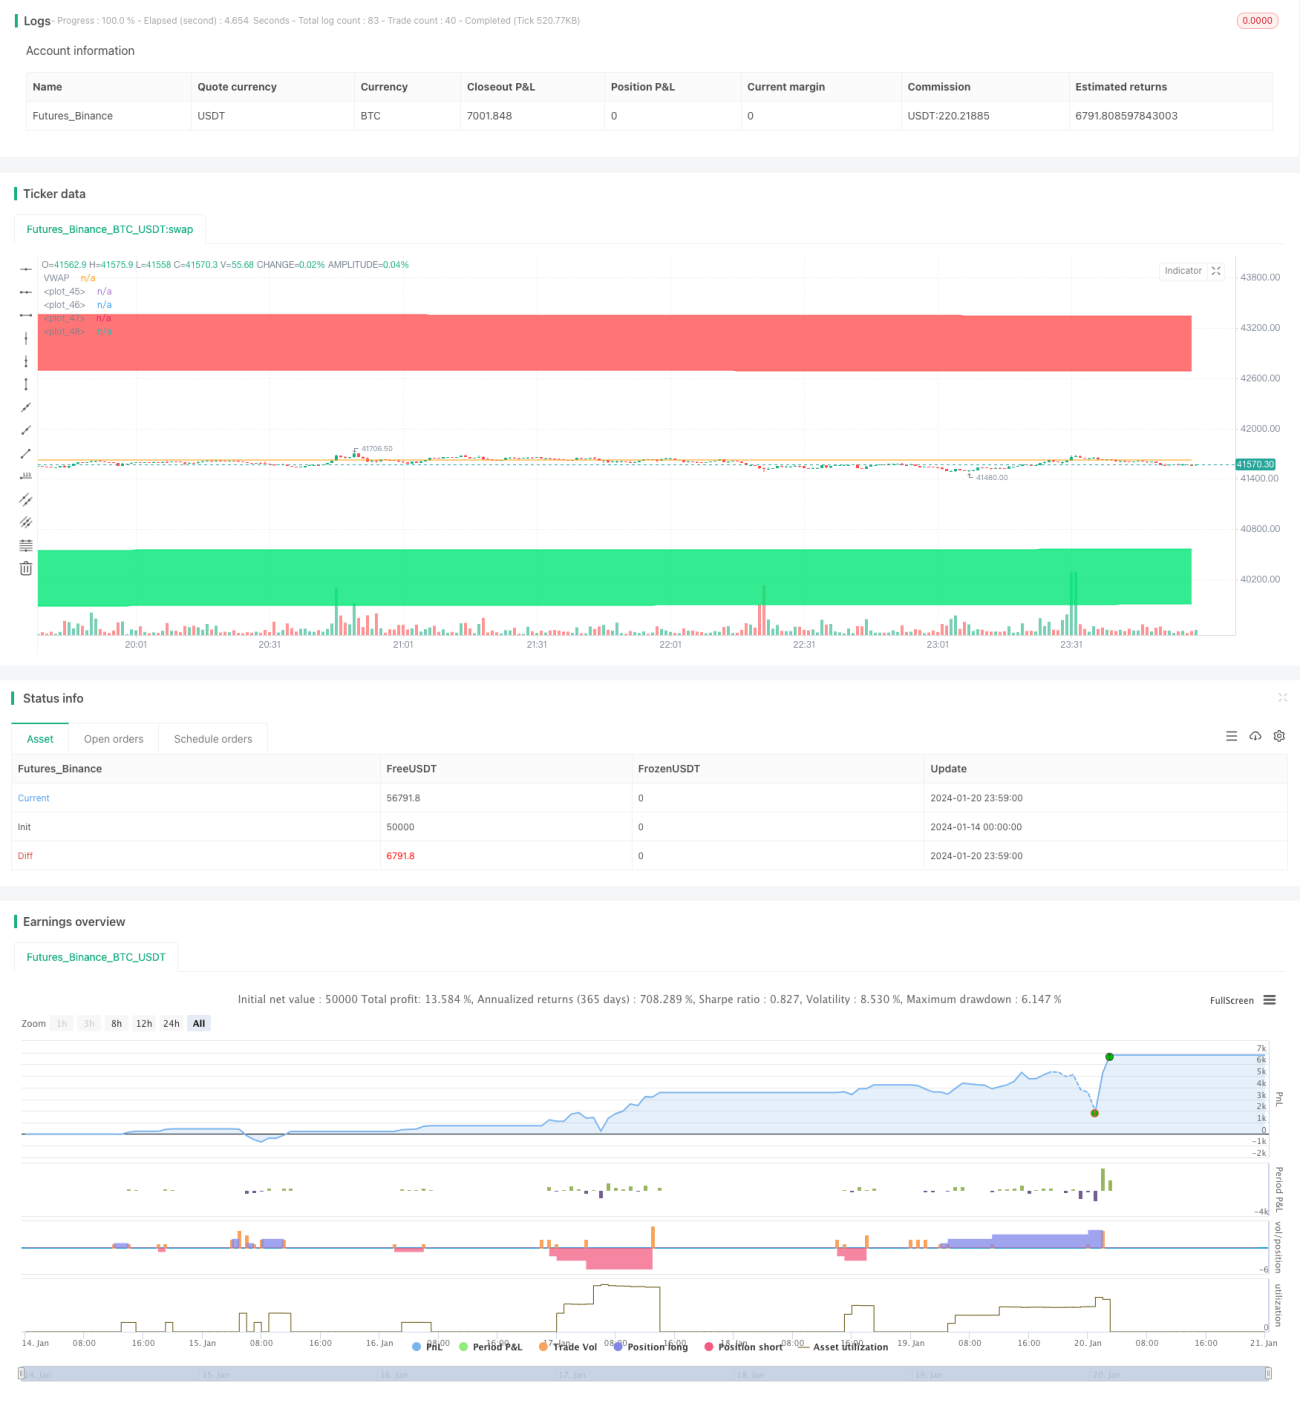
This strategy identifies and tracks trends based on price deviation indicators combined with Fibonacci retracement areas. Trading signals are generated when the price deviates further and further from one direction.
Strategy Logic
The strategy uses VWAP as the midpoint line of the price. Then the upper and lower bands of 1.618 and 2.618 standard deviation of price fluctuations are calculated. A long signal is generated when the price breaks through the lower band upwards. A short signal is generated when the price breaks through the upper band downwards.
The stop loss EXIT signals after opening long or short positions are: the stop loss line for long positions is the lower band, and for short positions is the upper band.
Specifically, it involves the following steps:
-
Calculate VWAP as the midpoint line of the price
-
Calculate the standard deviation sd of the price as an indicator of price volatility
-
Calculate the upper and lower bands based on sd. The upper bands are VWAP + 1.618sd and VWAP + 2.618sd. The lower bands are VWAP - 1.618sd and VWAP - 2.618sd.
-
A long signal is generated when the price breaks through the 1.618 lower band upwards. A short signal is generated when the price breaks through the 1.618 upper band downwards.
-
Long stop loss EXIT: price breaks through 2.618 lower band; Short stop loss EXIT: price breaks through 2.618 upper band.
Advantage Analysis
The strategy has the following advantages:
-
Price deviation indicators can effectively determine price trends and track trends
-
Fibonacci retracement areas make entry and stop loss exits clearer
-
VWAP as the midpoint line of the price also enhances the reference value of the indicator
-
Parameters can be adjusted to suit different products and timeframes
Risk Analysis
The strategy also has some risks:
-
It may incur greater losses during trend reversals
-
Improper parameter settings can also affect strategy performance
-
There is a higher stop loss risk during violent price fluctuations
Countermeasures:
-
Appropriately shorten the holding period and stop losses in time
-
Optimize parameters to find the best parameter combination
-
Increase position sizing management to control single loss
Optimization Directions
The strategy can also be optimized in the following areas:
-
Incorporate trend indicators to avoid counter trend trading
-
Add position sizing management mechanisms
-
Optimize parameter settings
-
Backtest and optimize over multiple timeframes
Summary
This strategy identifies and tracks trends based on the price deviation concept combined with VWAP and Fibonacci standard deviation bands. Compared to using single indicators like moving averages, this strategy has clearer judgments and risk control. Through parameter adjustment and optimization, the strategy can be adapted to different products and timeframes to achieve better performance.
- 1