概述
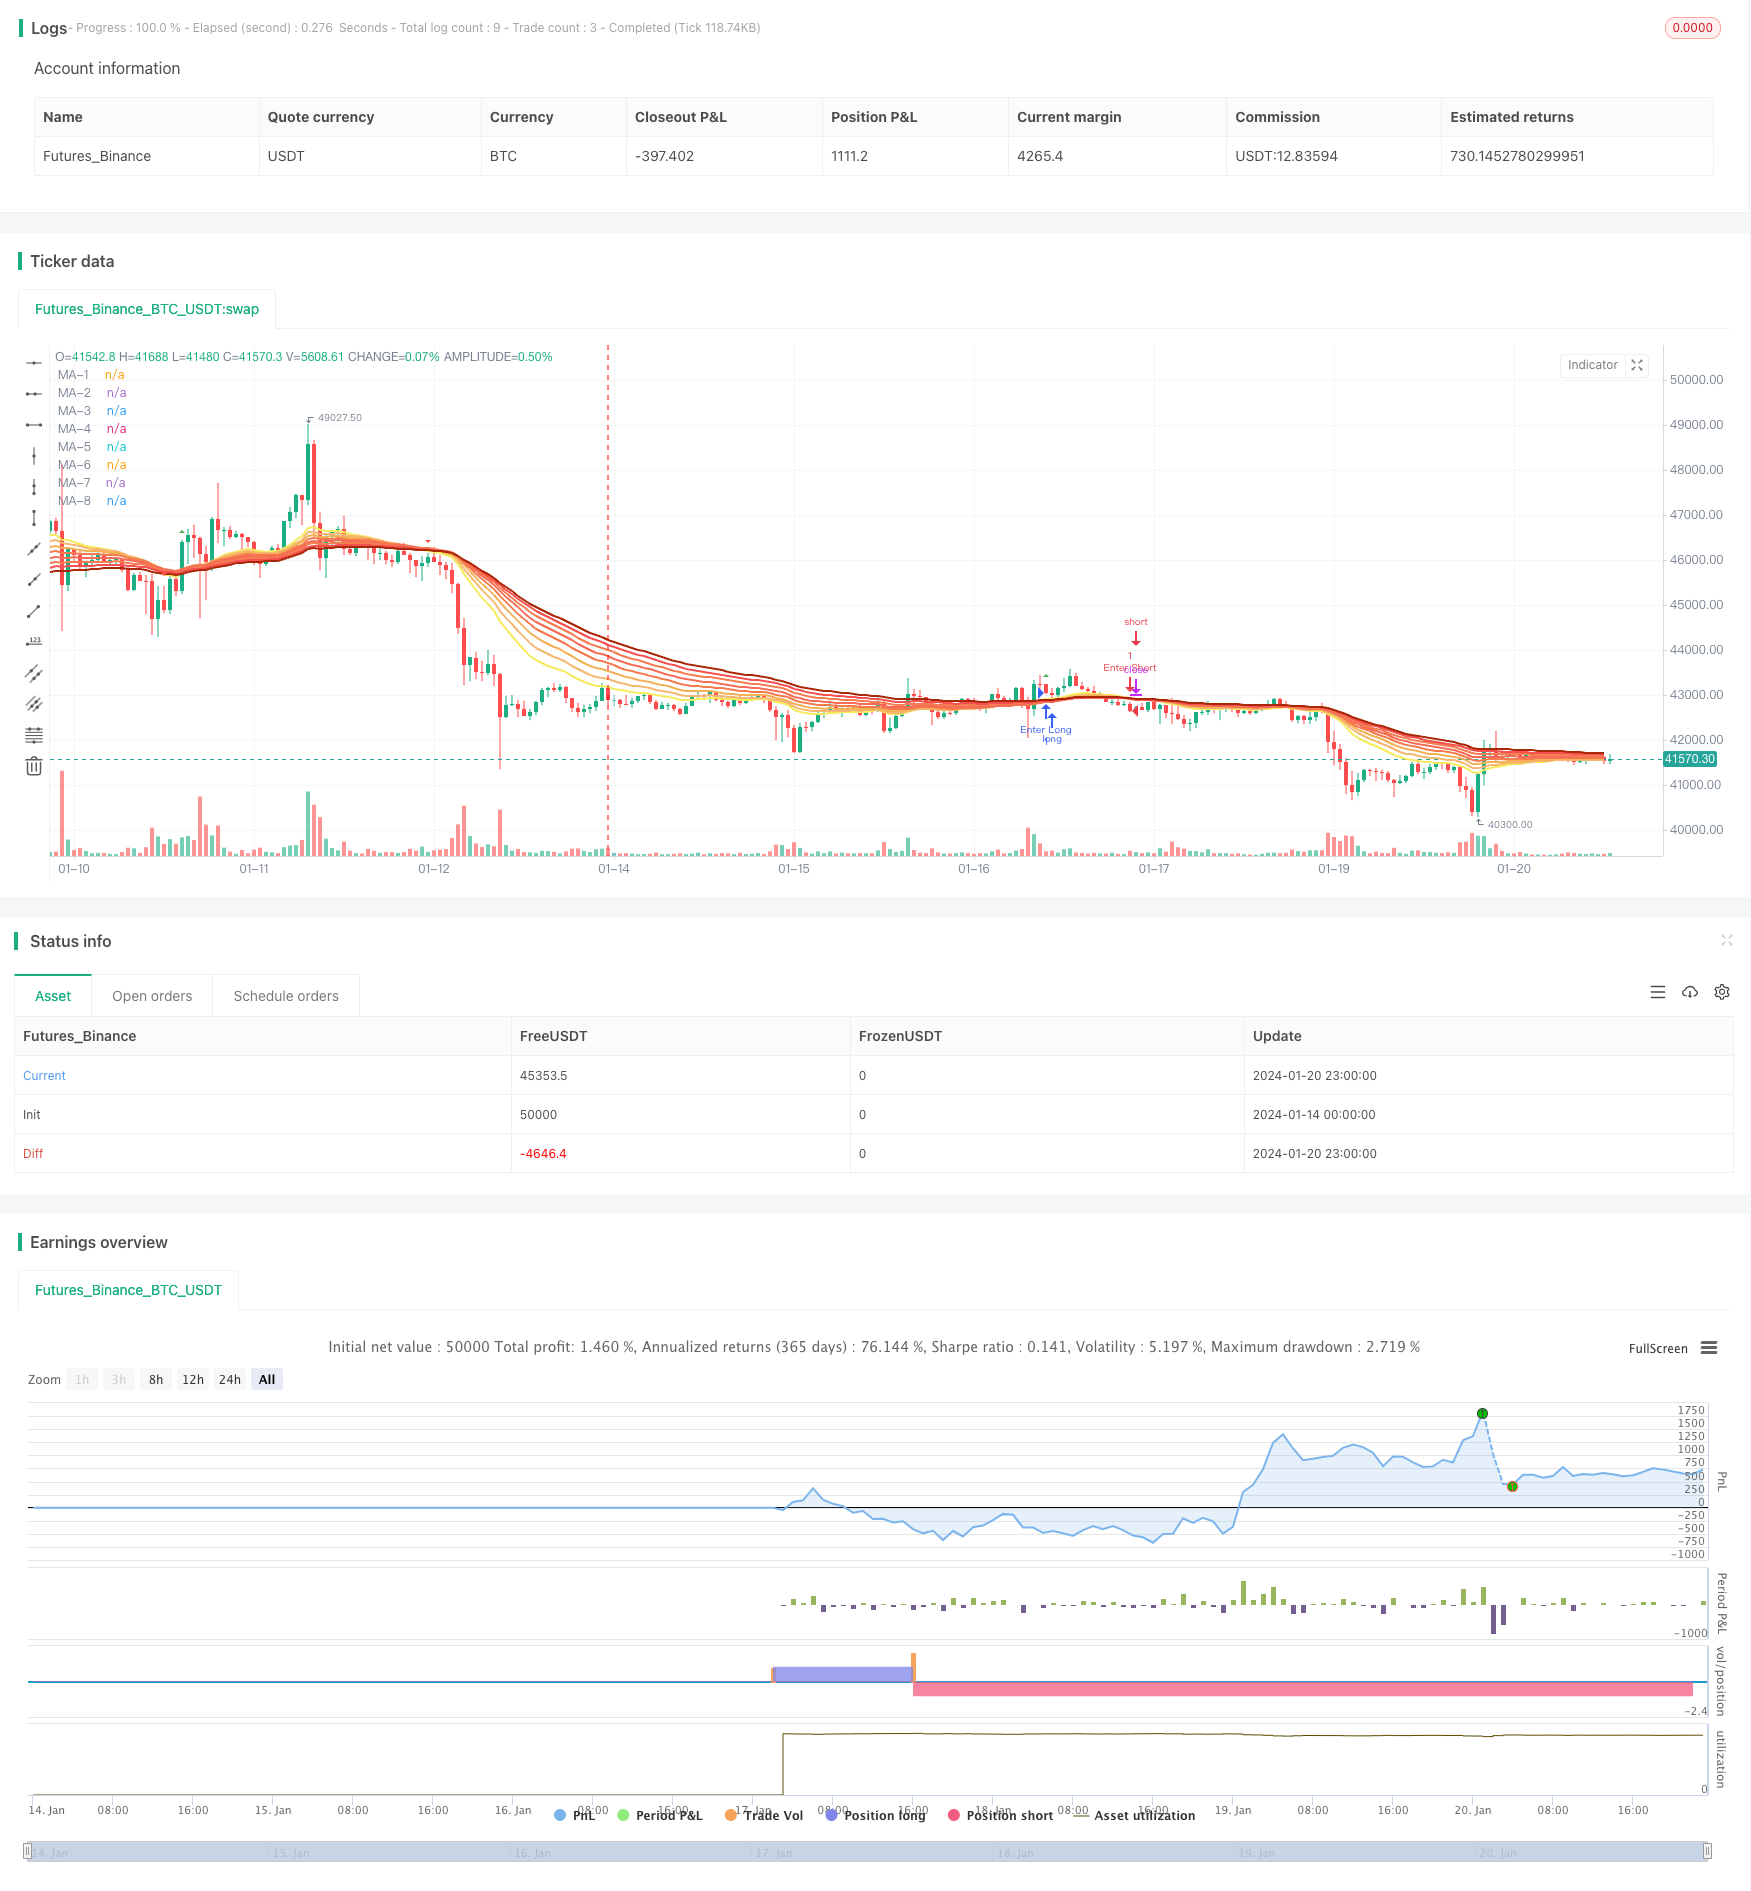
移动平均线叠带策略通过计算不同周期的移动平均线,并根据它们的交叉情况来产生交易信号。该策略使用8条不同周期的指数移动平均线构建移动平均线叠带,根据最短周期和最长周期的移动平均线交叉情况来判断市场趋势和产生交易信号。
策略原理
该策略主要基于8条移动平均线:20日线、25日线、30日线、35日线、40日线、45日线、50日线和55日线。这8条移动平均线构建成自下而上的移动平均线叠带。当短周期移动平均线从下方向上突破长周期移动平均线时,产生买入信号;当短周期移动平均线从上方向下跌破长周期移动平均线时,产生卖出信号。
例如,当20日线从下方向上突破55日线时,产生买入信号;当20日线从上方向下跌破55日线时,产生卖出信号。移动平均线能很好地指示市场趋势,该策略利用多个移动平均线交叉情况判断市场主要趋势,并产生交易信号。
优势分析
移动平均线叠带策略具有以下优势:
使用多条不同周期移动平均线,能更准确判断市场趋势变化。
多条移动平均线构建叠带,使交易信号更加清晰。
结合长短周期移动平均线,既考虑了市场长期趋势,也考虑了短期调整。
策略参数优化空间大,可以通过调整移动平均线的周期等参数来优化策略。
策略逻辑简单清晰,容易理解和实现。
风险分析
移动平均线叠带策略也存在一些风险:
大盘整体无法确定趋势时,可能产生错误信号。可通过结合其他指标进行确认。
交易频率可能过高,增加交易成本和滑点成本。可适当调整移动平均线周期,降低交易频率。
参数设置不当可能导致过于灵敏或过于滞后。需反复测试优化参数。
突发事件导致快速跳空可能使策略失效。可设置止损策略控制风险。
优化方向
移动平均线叠带策略可从以下方面进行优化:
调整移动平均线的周期参数,寻找最优参数组合。
增加其他技术指标进行信号过滤和确认,提高信号准确率。
结合波动率指标,在低波动环境中降低交易频率。
设置止损策略,控制单笔损失。
优化资金管理策略,提高盈利因子。
测试不同品种合约的参数健壮性。寻找最佳品种。
总结
移动平均线叠带策略整体思路清晰,通过多条移动平均线交叉判断市场趋势,并产生交易信号。策略优化空间大,可调整参数、增加信号过滤等方法进行优化。总体来说,该策略较为简单实用,适合量化交易入门学习。但仍需注意控制交易频率和风险。
/*backtest
start: 2024-01-14 00:00:00
end: 2024-01-21 00:00:00
period: 1h
basePeriod: 15m
exchanges: [{"eid":"Futures_Binance","currency":"BTC_USDT"}]
*/

//@version=4
strategy(title="EMA Ribbon [Krypt] with Buy/Sell Signals", shorttitle="EMA Ribbon", overlay=true)

dropn(src, n) =>
    na(src[n]) ? na : src

length1 = input(20, title="MA-1 period", minval=1)
length2 = input(25, title="MA-2 period", minval=1)
length3 = input(30, title="MA-3 period", minval=1)
length4 = input(35, title="MA-4 period", minval=1)
length5 = input(40, title="MA-5 period", minval=1)
length6 = input(45, title="MA-6 period", minval=1)
length7 = input(50, title="MA-7 period", minval=1)
length8 = input(55, title="MA-8 period", minval=1)
source_input = input(close, title="Source")

price = dropn(source_input, 1)

ema1 = ema(price, length1)
ema2 = ema(price, length2)
ema3 = ema(price, length3)
ema4 = ema(price, length4)
ema5 = ema(price, length5)
ema6 = ema(price, length6)
ema7 = ema(price, length7)
ema8 = ema(price, length8)

plot(ema1, title="MA-1", color=#f5eb5d, transp=0, linewidth=2)
plot(ema2, title="MA-2", color=#f5b771, transp=0, linewidth=2)
plot(ema3, title="MA-3", color=#f5b056, transp=0, linewidth=2)
plot(ema4, title="MA-4", color=#f57b4e, transp=0, linewidth=2)
plot(ema5, title="MA-5", color=#f56d58, transp=0, linewidth=2)
plot(ema6, title="MA-6", color=#f57d51, transp=0, linewidth=2)
plot(ema7, title="MA-7", color=#f55151, transp=0, linewidth=2)
plot(ema8, title="MA-8", color=#aa2707, transp=0, linewidth=2)

// Buy and sell signals based on crossover and crossunder
buySignal = crossover(ema1, ema8)
sellSignal = crossunder(ema1, ema8)

plotshape(series=buySignal, title="Buy Signal", color=color.green, style=shape.triangleup, size=size.small)
plotshape(series=sellSignal, title="Sell Signal", color=color.red, style=shape.triangledown, size=size.small)

if buySignal
    strategy.entry("Enter Long", strategy.long)
else if sellSignal
    strategy.entry("Enter Short", strategy.short)