概述
本策略利用CCI指标的枢纽点来计算动态的支撑位和阻力位,结合趋势判断来寻找买入和卖出信号。该策略融合了CCI的反转特征以及趋势跟踪能力,旨在抓住中期趋势中的反转点来实现盈利。
策略原理
CCI指标能够显示市场是否过于疲弱或过于强势,80和-80这两个极限值可以用来判断市场是否进入超买超卖状态。本策略利用CCI的这个特性,通过计算左右两边各50根K线的枢纽点,得到上枢纽点和下枢纽点,然后在枢纽点的基础上加减缓冲区构建动态的阻力线和支撑线。
当收盘价高于开盘价且低于上支撑线时生成买入信号;当收盘价低于开盘价且高于下阻力线时生成卖出信号。为了过滤掉非主流趋势方向的交易信号,策略还结合EMA和斜率指标来判断目前的主流趋势方向。只有当趋势判断为多头时,才会进行买入操作;只有当趋势判断为空头时,才会进行卖出操作。
止损和止盈基于ATR指标动态计算,使得本策略的风险控制也比较合理。
优势分析
- 利用CCI指标的反转特征,选取反转点附近进行买卖,增加获利概率。
- 结合趋势判断,避免逆势操作,减少损失。
- 动态止损止盈设定让风险控制更合理。
- 可自定义参数如CCI周期、缓冲区大小等,适应更多市场环境。
风险分析
- CCI指标容易产生虚假信号,需结合趋势过滤。
- 反转不一定成功,存在一定概率亏损的风险。
- 参数设置不当可能导致过于频繁交易或错过交易机会。
可以通过优化参数,调整止损幅度等方法来减少风险。此外,本策略也可作为其它指标的辅助工具,而不必完全依赖其交易信号。
优化方向
- 优化缓冲区大小,适应不同波动率市场。
- 优化ATR周期参数,以取得更准确的动态止损止盈。
- 尝试不同的CCI参数设置。
- 测试其它类型的趋势判断指标的效果。
总结
本策略整合了CCI指标的多空筛选能力与趋势判断的过滤确认,具有一定的实战价值。动态止损止盈也使得策略在实际应用中风险可控。通过参数优化和改进,可望获得更好的效果。
策略源码
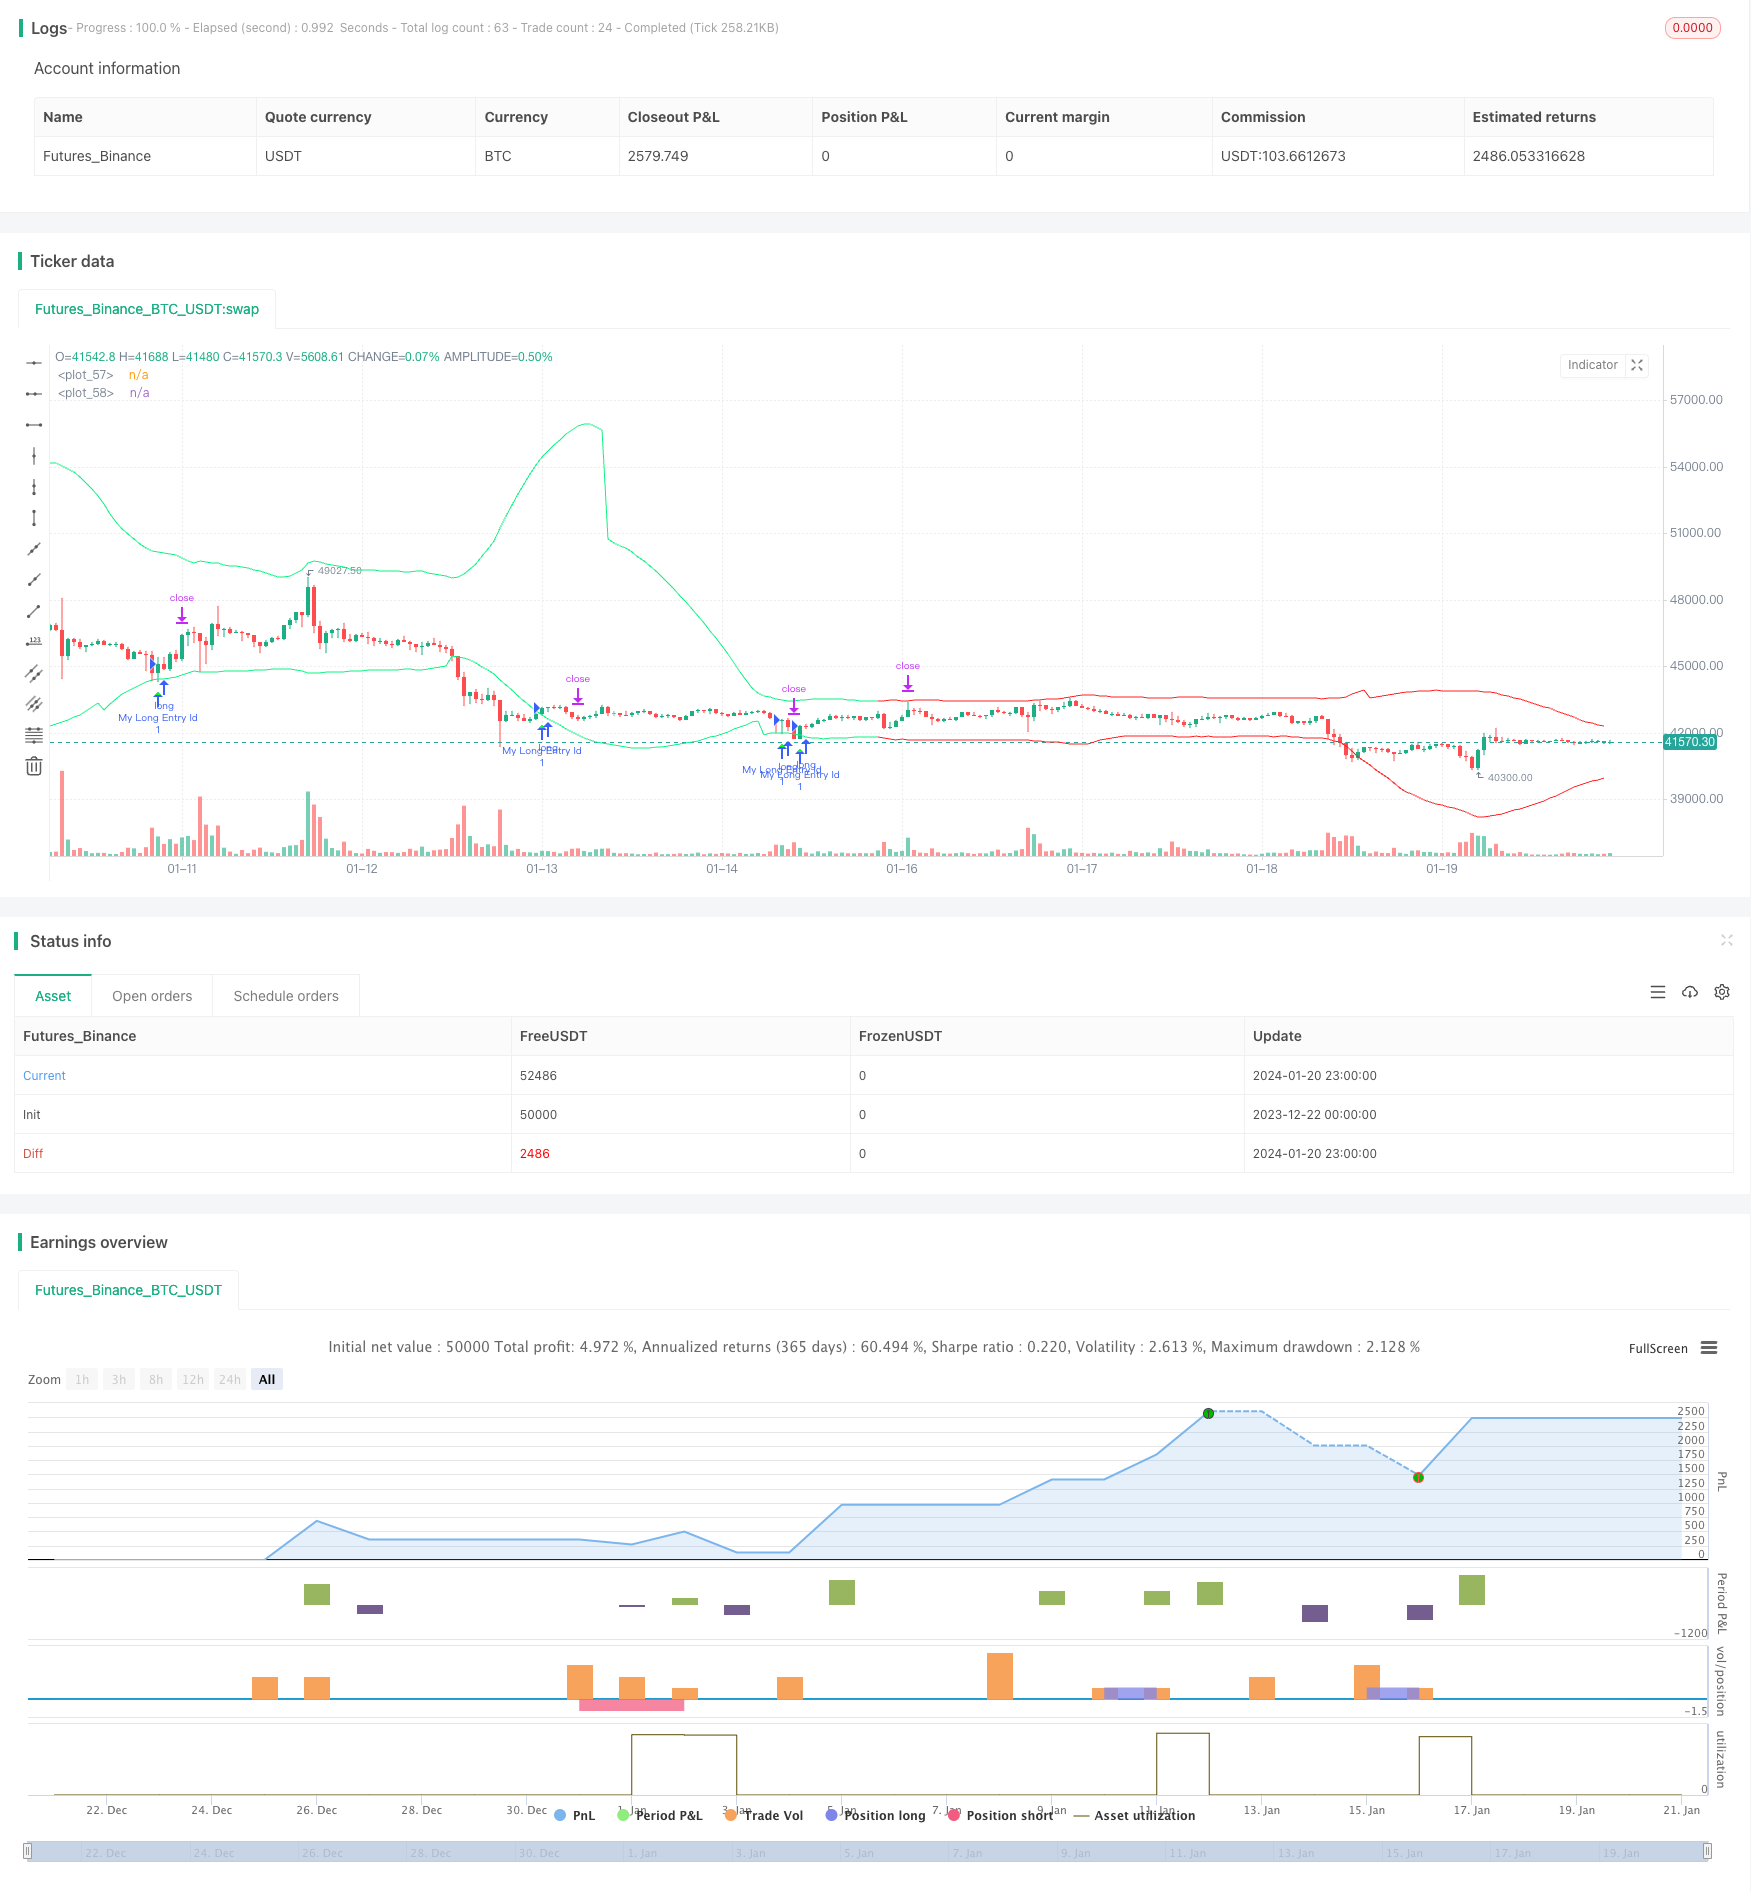
/*backtest
start: 2023-12-22 00:00:00
end: 2024-01-21 00:00:00
period: 1h
basePeriod: 15m
exchanges: [{"eid":"Futures_Binance","currency":"BTC_USDT"}]
*/

// This Pine Script™ code is subject to the terms of the Mozilla Public License 2.0 at https://mozilla.org/MPL/2.0/
// © AliSignals


//@version=5
strategy("CCI based support and resistance strategy", overlay=true  )


cci_length = input.int(50, "cci length")
right_pivot = input.int(50, "right pivot")
left_pivot = input.int(50, "left pivot")
buffer = input.float(10.0, "buffer")
trend_matter = input.bool(true, "trend matter?")
showmid = input.bool ( false , "show mid?")
trend_type = input.string("cross","trend type" ,options = ["cross","slope"])
slowma_l = input.int(100, "slow ma length")
fastma_l = input.int(50, "fast ma length")
slope_l = input.int(5,  "slope's length for trend detection")
ksl = input.float(1.1)
ktp = input.float(2.2)
restf = input.timeframe(title="Time Frame of Last Period for Calculating max" , defval="D")


// Calculating Upper and Lower CCI
cci = ta.cci(hlc3,cci_length)

uppercci = 0.0
lowercci = 0.0

uppercci := fixnan(ta.pivothigh(cci, left_pivot, right_pivot)) - buffer
lowercci := fixnan(ta.pivotlow (cci, left_pivot, right_pivot)) + buffer
midccci  = math.avg(uppercci,lowercci)


// Support and Resistance based on CCI
res = uppercci*(0.015*ta.dev(hlc3,cci_length))+ ta.sma(hlc3,cci_length)
sup = lowercci*(0.015*ta.dev(hlc3,cci_length))+ ta.sma(hlc3,cci_length)
mid =  midccci*(0.015*ta.dev(hlc3,cci_length))+ ta.sma(hlc3,cci_length)


// Calculating trend
t_cross  = 0
t_cross := ta.ema(close,fastma_l) > ta.ema(close,slowma_l) ? 1 : ta.ema(close,fastma_l) < ta.ema(close,slowma_l) ? -1 : t_cross[1]

t_slope  = 0
t_slope := ta.ema(close,slowma_l) > ta.ema(close,slowma_l)[slope_l] ? 1 : ta.ema(close,slowma_l) < ta.ema(close,slowma_l)[slope_l]  ? -1 : t_slope[1]

t  = 0
t := trend_type == "cross" ? t_cross : trend_type == "slope" ? t_slope : na

colort =  trend_matter == false ? color.rgb(201, 251, 0) : t == 1 ? color.rgb(14, 243, 132) :  t == -1 ? color.rgb(255, 34, 34) : na
bull_t = trend_matter == false or t ==  1
bear_t = trend_matter == false or t == -1

plot(res, color = colort)
plot(sup, color = colort)
plot(showmid == true ? mid : na)


// Long and Short enter condition
buy  = bull_t == 1 and ta.lowest (2) < sup and close > open and close > sup
sell = bear_t == 1 and ta.highest(2) > res and close < open and close < res

plotshape( buy , color=color.rgb(6, 255, 23) , location = location.belowbar, style = shape.triangleup  , size = size.normal)
plotshape( sell, color=color.rgb(234, 4, 4) ,  location = location.abovebar, style = shape.triangledown, size = size.normal)


atr = ta.atr(100)


CLOSE=request.security(syminfo.tickerid, restf, close)
max = 0.0
max := CLOSE == CLOSE[1] ? math.max(max[1], atr) : atr
act_atr = 0.0
act_atr := CLOSE == CLOSE[1] ? act_atr[1] : max[1]

atr1 =  math.max(act_atr, atr)

dis_sl = atr1 * ksl
dis_tp = atr1 * ktp


var float longsl  = open[1] - dis_sl
var float shortsl = open[1] + dis_sl
var float longtp =   open[1] + dis_tp
var float shorttp =  open[1] - dis_tp


longCondition = buy
if (longCondition)
    strategy.entry("My Long Entry Id", strategy.long)

shortCondition = sell
if (shortCondition)
    strategy.entry("My Short Entry Id", strategy.short)


longsl  := strategy.position_size > 0  ? longsl[1]  : close - dis_sl
shortsl := strategy.position_size < 0 ? shortsl[1] : close + dis_sl
longtp  := strategy.position_size > 0  ? longtp[1]  : close + dis_tp
shorttp := strategy.position_size < 0 ? shorttp[1] : close - dis_tp


if strategy.position_size > 0
    strategy.exit(id="My Long close Id", from_entry ="My Long Entry Id" , stop=longsl, limit=longtp)
if strategy.position_size < 0
    strategy.exit(id="My Short close Id", from_entry ="My Short Entry Id" , stop=shortsl, limit=shorttp)