Trend Tracking and Short-term Trading Strategy Based on ADX Indicator

Author: ChaoZhang, Date: 2024-01-22 17:10:55
Tags:

img

Overview

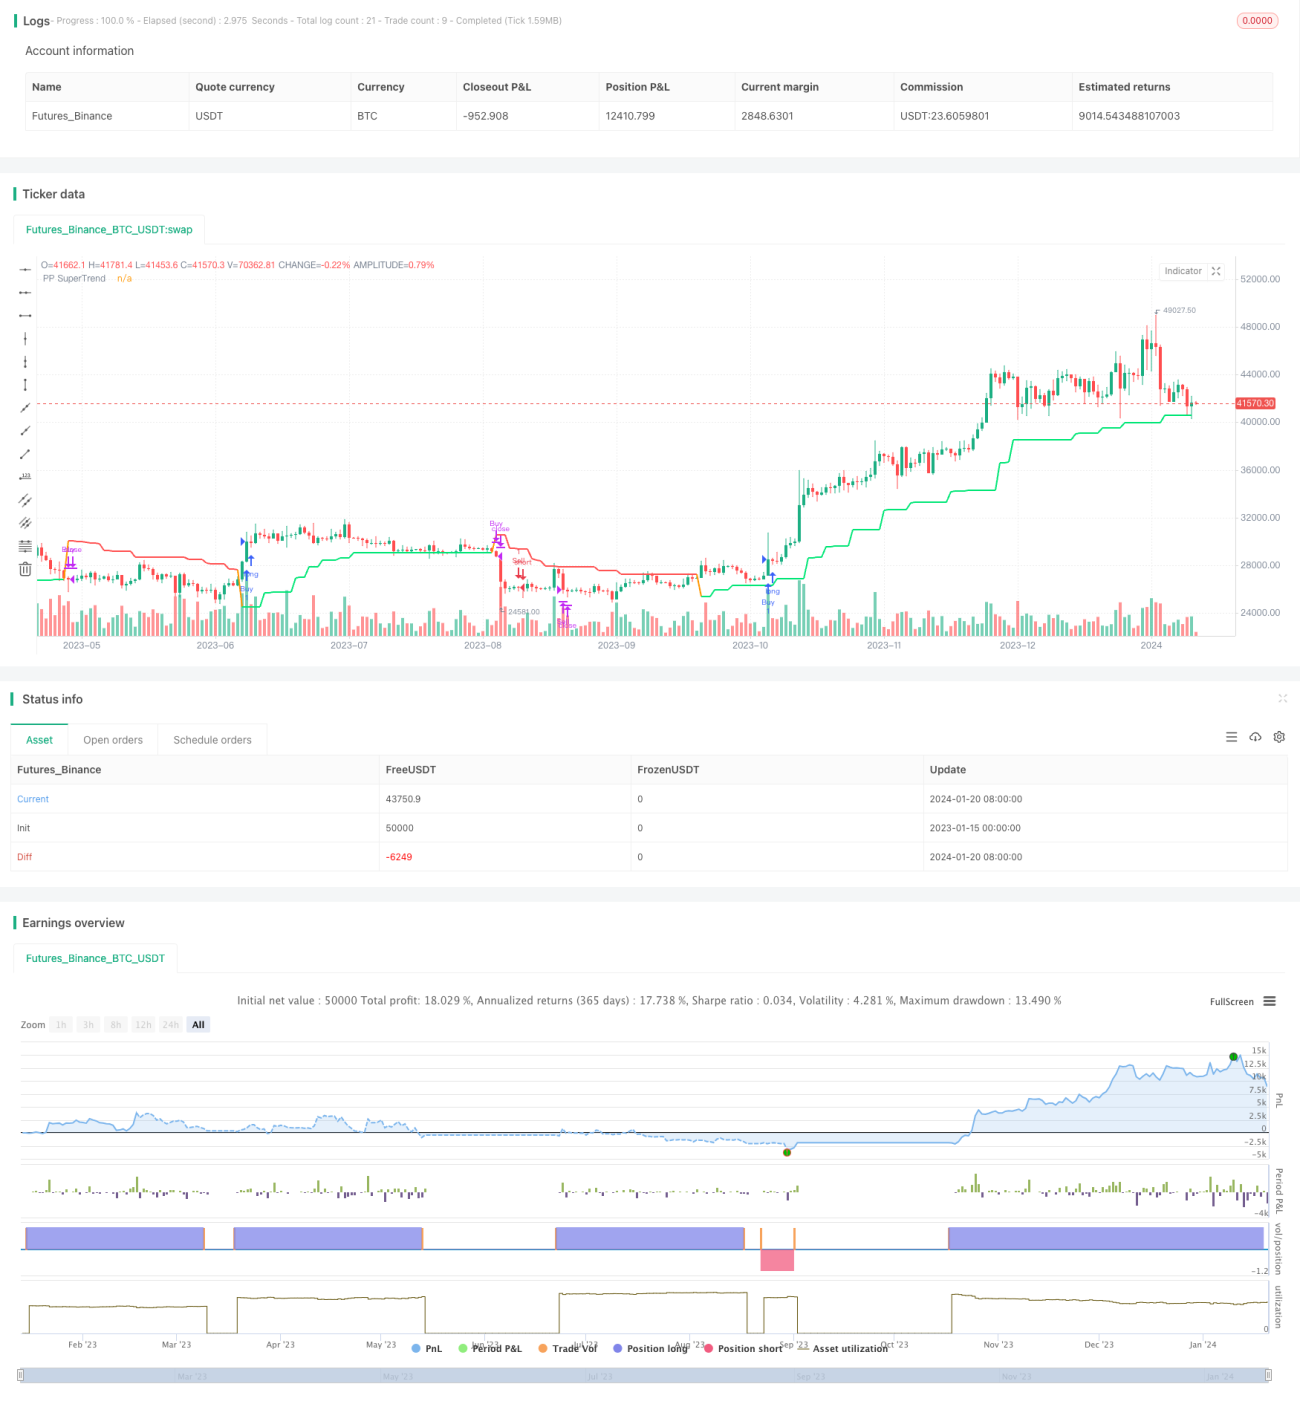
This strategy combines the Super Trend, Pivot Points and Average True Range (ATR) to form a dynamic stop loss line, and the Average Directional Movement Index (ADX) indicator to judge and track trends. The strategy is suitable for short-term trading and can capture the trend continuation after range-bound. The drawdown control is also decent.

Principle

The Super Trend combined with Pivot Points and ATR stop loss judges the direction of price breaking through the dynamic stop loss line to determine the opening direction. At the same time, the ADX indicator judges the strength of the trend and only issues trading signals when the trend is strong enough.

Specifically, the Pivot Points first obtain the latest support and resistance, and then form a dynamic middle price with the arithmetic mean of the previous two days. Then ATR is calculated and multiplied by the ATR factor, and then added to or subtracted from the dynamic middle price to obtain the upper and lower rails. When the price breaks through the upper rail, it is bullish. When it breaks through the lower rail, it is bearish. The ADX indicator judges the strength of the trend, and only participates in trading when the trend is strong enough.

The stop loss line will be dynamically adjusted according to the latest price and ATR value, which can track the trend very well.

Advantage Analysis

The strategy has the following advantages:

  1. Use the Super Trend indicator to track the direction of trend running to avoid locking in profits by oscillating markets.

  2. With the help of the ADX indicator to judge the strength of the trend, avoid errors in trading during consolidation.

  3. The stop loss line is dynamically adjusted to maximize lock-in profits.

  4. Combine RSI to avoid overbuying and overselling.

  5. Overall, the strategy parameter setting is reasonable. The selection of dframe considers continuity. The setting of take profit and stop loss is also good.

Risk Analysis

The strategy also has some risks:

  1. Super Trend and MA indicators may issue conflicting signals.

  2. The ADX indicator is set to 14 cycles, which is not sensitive enough to sudden events.

  3. The RSI parameter is set to default, which may fail to completely avoid overbought and oversold.

  4. The impact of sudden events has not been considered, such as major bad/good news.

Corresponding solutions:

  1. Adjust the MA cycle to match the Super Trend indicator.

  2. Try to shorten the ADX cycle to increase sensitivity to sudden events.

  3. Optimize RSI parameters to find optimal values.

  4. Add news filter module to avoid major news releases.

Optimization

The strategy can also be optimized in the following aspects:

  1. Add machine learning model to judge the trend, making trading decisions more intelligent.

  2. Try to introduce alternative emotional indicators instead of ADX to judge the strength of the trend.

  3. Increase adaptive stop loss module to make stop loss more dynamic and accurate.

  4. Extract more features with deep learning technology to optimize the overall strategy.

  5. Use advanced languages ​​like Python for strategy development to increase strategy scalability.

Summary

Overall, this strategy is very practical. The core is to track the direction of the trend run and participate when the trend is strong enough. The setting of stop loss and take profit is also very in place to maximize locking in profits while avoiding losses. Of course, there is still a lot of room for optimization. Adding machine learning and deep learning technology will make the strategy more effective and expandable.


/*backtest
start: 2023-01-15 00:00:00
end: 2024-01-21 00:00:00
period: 1d
basePeriod: 1h
exchanges: [{"eid":"Futures_Binance","currency":"BTC_USDT"}]
*/

//@version=5
strategy("Bendre ADX STrend", overlay = true)

///////////////////////////
// SuperTrend + Pivot Point
//////////////////////////

src =  input(close, title="EMA Source")
PPprd = input(defval = 2, title="Pivot Point Period")
AtrFactor=input(defval = 2, title = "ATR Factor")
AtrPd=input(defval = 21, title = "ATR Period")

StartDate = input(timestamp("1 Dec 2023"), title="Start Date")
EndDate = input(timestamp("12 Jan 2024"), title="End Date")
window()  => true

var float ph = na
var float pl = na
ph := ta.pivothigh(PPprd, PPprd)
pl :=ta.pivotlow(PPprd, PPprd)

float center = na
center := center[1]
// float lastpp = ph ? ph : pl ? pl : 0.0
float lastpp = na(ph) ? na(pl) ? na : pl : ph

if lastpp > 0
    if na(center)
        center := lastpp
    else
        center := (center * 2 + lastpp) / 3

Up = center - (AtrFactor * ta.atr(AtrPd))
Dn = center + (AtrFactor * ta.atr(AtrPd))

var float TUp = na
var float TDown = na
Trend = 0
TUp := close[1] > TUp[1] ? math.max(Up, TUp[1]) : Up
TDown := close[1] < TDown[1] ? math.min(Dn, TDown[1]) : Dn
Trend := close > TDown[1] ? 1: close < TUp[1]? -1: nz(Trend[1], 1)
Trailingsl = Trend == 1 ? TUp : TDown

// Lines
linecolor = Trend == 1 and nz(Trend[1]) == 1 ? color.lime : Trend == -1 and nz(Trend[1]) == -1 ? color.red : na
plot(Trailingsl, color = linecolor ,  linewidth = 2, title = "PP SuperTrend")

bsignalSSPP = close > Trailingsl
ssignalSSPP = close < Trailingsl


///////
// ADX
//////

lenADX = 14
th = 14
TrueRange = math.max(math.max(high-low, math.abs(high-nz(close[1]))), math.abs(low-nz(close[1])))
DirectionalMovementPlus = high-nz(high[1]) > nz(low[1])-low ? math.max(high-nz(high[1]), 0): 0
DirectionalMovementMinus = nz(low[1])-low > high-nz(high[1]) ? math.max(nz(low[1])-low, 0): 0
SmoothedTrueRange = 0.0
SmoothedTrueRange := nz(SmoothedTrueRange[1]) - (nz(SmoothedTrueRange[1])/lenADX) + TrueRange
SmoothedDirectionalMovementPlus = 0.0
SmoothedDirectionalMovementPlus := nz(SmoothedDirectionalMovementPlus[1]) - (nz(SmoothedDirectionalMovementPlus[1])/lenADX) + DirectionalMovementPlus
SmoothedDirectionalMovementMinus = 0.0
SmoothedDirectionalMovementMinus := nz(SmoothedDirectionalMovementMinus[1]) - (nz(SmoothedDirectionalMovementMinus[1])/lenADX) + DirectionalMovementMinus
DIPlus = SmoothedDirectionalMovementPlus / SmoothedTrueRange * 100
DIMinus = SmoothedDirectionalMovementMinus / SmoothedTrueRange * 100
DX = math.abs(DIPlus-DIMinus) / (DIPlus+DIMinus)*100
ADX = ta.sma(DX, lenADX)


//////
// MA
/////

lenMA = 21
srcMA = input(close, title="Source")
// offsetMA = input(title="Offset", type=input.integer, defval=0, minval=-500, maxval=500)
offsetMA = input(0, title="Offset")
outMA = ta.sma(srcMA, lenMA)

//
// RSI
//
length = input( 14 )
overSold = input( 30 )
overBought = input( 65 )
price = close
vrsi = ta.rsi(price, length)

//
// DMI - Direction Movement Index
// 
[diplus1, diminus1, adx] = ta.dmi(14, 14)

// Buy - Sell Entries
buy = bsignalSSPP and outMA < close and ADX > th
sell = ssignalSSPP 


if (buy and vrsi > overBought and adx > 19)
    // .order // Tuned version
    strategy.entry("Buy", strategy.long, when = window())
    // strategy.close("Sell", "close Sell")

if (sell) and (strategy.position_size > 0)
    // strategy.entry("Sell", strategy.short)
    strategy.close("Buy", "Close Buy")

if(sell and vrsi < overSold and adx > 25)
    strategy.entry("Sell", strategy.short, when = window())

if ( ta.crossover( diminus1, diplus1) or ((buy) and (strategy.position_size > 0)) )
    strategy.close("Sell", "close Sell")

// if(sell) and (diminus1 > diplus1) and adx > 23 and adx > adx[1] and (vrsi < overSold)
//     strategy.entry("Sell", strategy.short, when = window())

// if (strategy.position_size > 0 and ta.crossunder(diminus1, adx)) or (strategy.position_size > 0  and (buy))
//     strategy.close("Sell", "close Sell")


More