Quant Trading Strategy Based on Moving Average Crossover

Overview
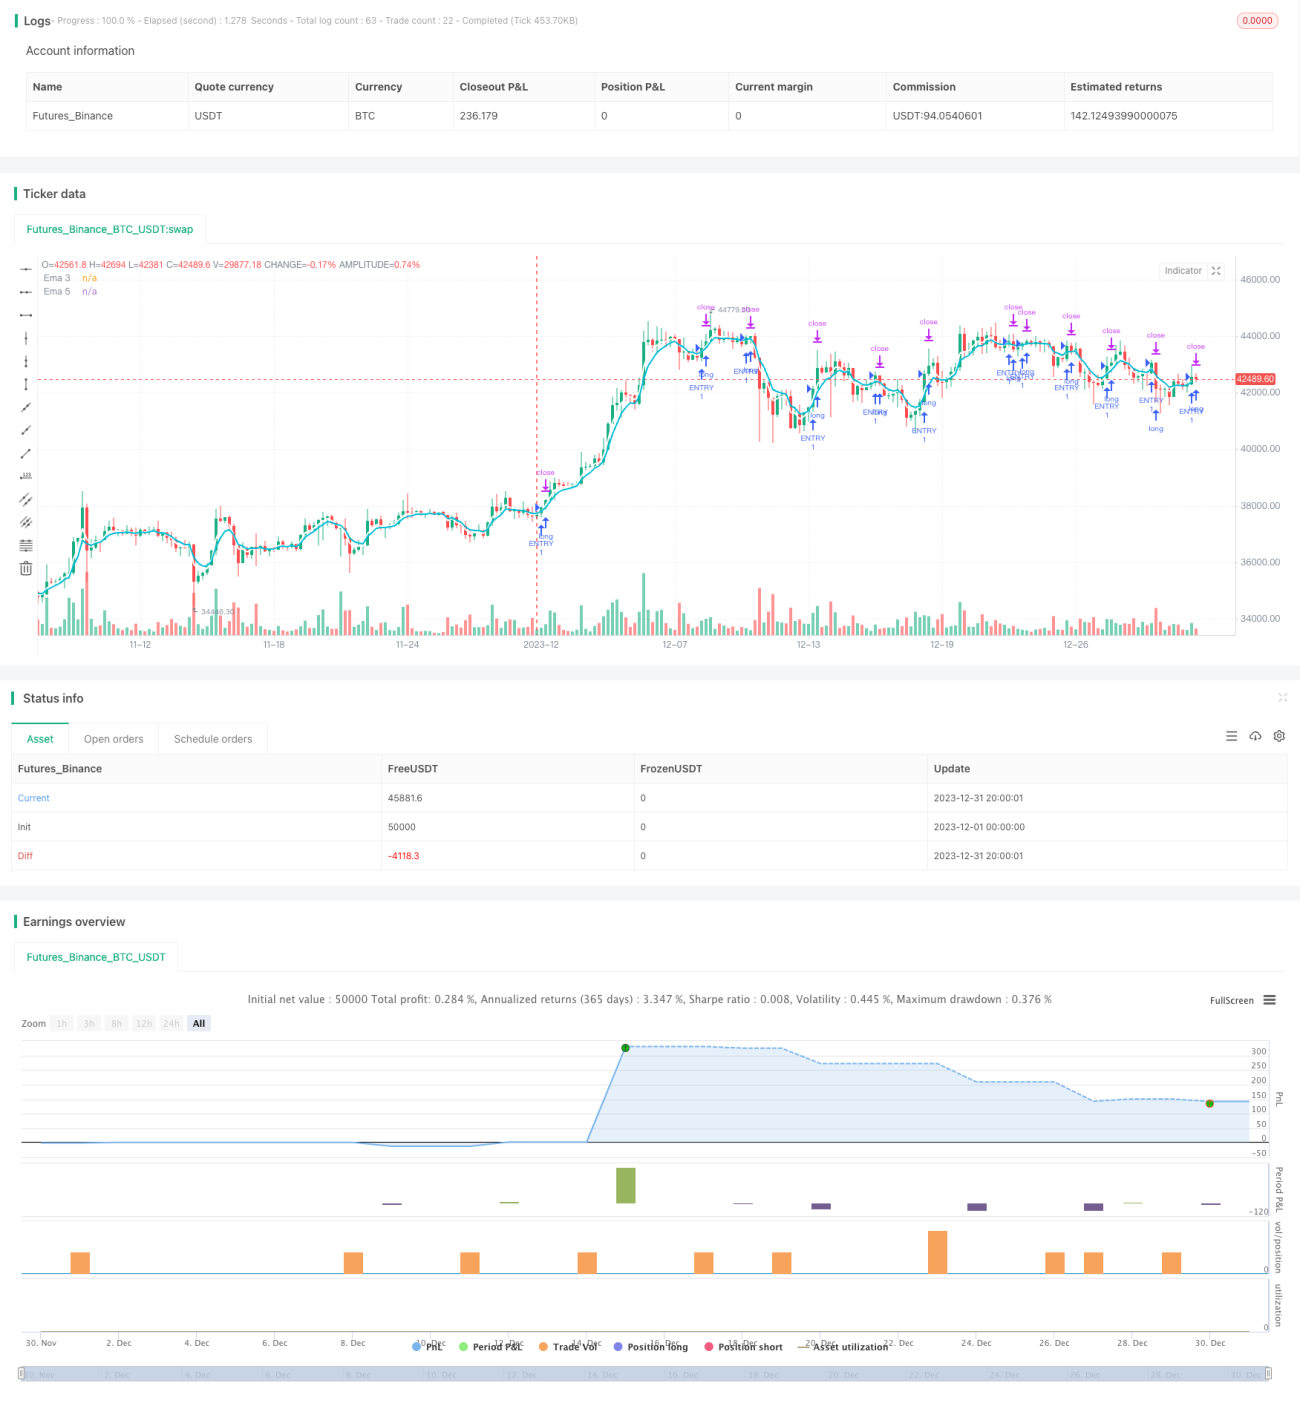
This strategy is built based on the golden cross and dead cross principles of simple moving averages (SMA). It uses the golden cross of 3-day and 5-day lines as the entry signal and stop loss or take profit as the exit signal.
Strategy Principle
The strategy is mainly based on two SMAs, the 3-day line and the 5-day line. Among them, the 3-day line represents the short-term trend, and the 5-day line represents the longer mid-term trend. When the short term rises rapidly, that is, when the 3-day line crosses above the 5-day line, it indicates that the current market is in an upward trend. At this time, go long. On the contrary, when the short term falls rapidly, that is, when the 3-day line crosses below the 5-day line, it indicates that the current market is in a downward trend. At this time, go short. By capturing the crossover of price changes between the two cycles of short-term and medium-term, the market can be better judged and the probability of successful entry can be improved.
Advantage Analysis
The strategy has the following advantages:
- The strategy logic is simple and clear, easy to understand and implement.
- The moving average crossover strategy makes relatively accurate judgments on the overall market trend with high probability of successful entry.
- Selecting moving averages of two different cycles can better grasp market changes.
- The implementation of take profit and stop loss mechanisms effectively controls losses.
Risk Analysis
The strategy also has some risks:
- Due to the use of shorter moving average cycles, it is prone to be affected by short-term market fluctuations, which may increase the probability of stop loss.
- The strategy is relatively mechanized and cannot adapt to special market conditions.
- It does not consider the judgment of long-term trends, which can cause the strategy to suffer greater losses in a long-term market downturn.
To reduce risks, we can consider optimizing the selection of entry moving averages, or adding auxiliary judgments of long-cycle moving averages. At the same time, the take profit and stop loss points can also be adjusted to better fit the real market conditions.
Optimization Directions
The strategy can be optimized in the following aspects:
- Increase more moving averages of different cycles to form multi-level screening to improve the stability of the strategy.
- Add judgments of other technical indicators such as MACD, RSI, etc. to assist entry.
- Add judgments on long-term trends to avoid going long in long-term downtrends.
- Optimize the take profit and stop loss points to better adapt to actual market fluctuations.
- Test longer backtest periods to evaluate parameter stability.
Summary
This strategy is constructed based on the principle of moving average crossover, adopting entry on golden cross and exit on stop loss or take profit. It is simple to implement and has relatively stable backtest results. By adding more auxiliary technical indicators, optimizing parameters, and expanding backtest range, etc., the stability and profitability of the strategy can be further enhanced. In general, the moving average strategy has good market adaptability and is worth further research and application.
- 1