Golden Cross Death Cross Long-term Multi-factor Strategy

Author: ChaoZhang, Date: 2024-01-23 11:11:40
Tags:

img

Overview

This is a long-term multi-factor strategy that combines moving average, RSI and ATR indicators to identify undervalued market conditions and generate buy signals. It is a long-term holding strategy focused on pursuing steady returns.

Strategy Logic

When the fast moving average crosses above the slow moving average, forming a golden cross signal, while the RSI indicator is below the overbought area, the market is considered undervalued and a buy signal is generated. Stop loss and take profit are then set based on the ATR indicator for fixed stop loss/take profit.

Specifically, the strategy uses 10-day and 50-day moving averages to form trading signals. A buy signal is generated when the 10-day MA crosses above the 50-day MA. At the same time, RSI (14) needs to be below the 70 overbought area to avoid buying at high points.

After entering the market, stop loss and take profit are set based on the size of ATR (14). The stop loss is set at the price below entry price by 1.5 times ATR; the take profit is set at the price above entry price by 2 times ATR.

Advantage Analysis

This is a long-term multi-factor strategy that combines multiple indicators to judge market conditions, which can effectively avoid losses caused by false breakouts. The main advantages are:

  1. Multi-factor judgment avoids false breakouts and ensures reliability of buy signals
  2. Tracks long-term trends without being stopped out by short-term fluctuations
  3. Fixed stop loss/take profit points prevent excessive losses
  4. Adjustable indicator parameters allow optimization across different products
  5. Simple to implement, easy to understand and operate

Risk Analysis

As a long-term holding strategy, the strategy also has some risks to note. The main risk points include:

  1. Large loss risk from long-term holding. May see sizable loss in prolonged consolidation market. Can set up trailing stop loss to mitigate.
  2. Stop tracking stop loss risk. Fixed stop loss is only set once after entry, no further adjustment, may get stop loss breached. Can optimize with dynamic stop loss or trailing stop loss.
  3. Indicators too slow, misses short-term trading opportunities. Can shorten indicator parameters appropriately to pursuit higher trading frequency.
  4. Risk magnification from trend following additions. Can set limits on frequency and size of additions to control risk.

Optimization Directions

The strategy can be optimized in the following aspects:

  1. Add dynamic stop loss mechanism, adjust stop loss based on price and volatility
  2. Add trailing take profit to better lock in profits
  3. Incorporate trading volume indicator to avoid low volume false breakout
  4. Optimize indicator parameters to fit more products
  5. Add trend following position addition mechanism to moderately add to winning positions

Conclusion

As a long-term multi-factor golden cross death cross strategy, it combines moving average, RSI and ATR indicators to generate trading signals based on multi-factor judgments, pursuing steady returns from long-term trends. With the characteristics of accurate judgment, clear stop loss, and simple execution, it is a recommended long-term strategy. At the same time, need to watch out for long holding risks, dynamically adjust stop loss and take profit. Overall, with parameter optimization, the strategy can become an effective long-term strategy to produce steady returns.


/*backtest
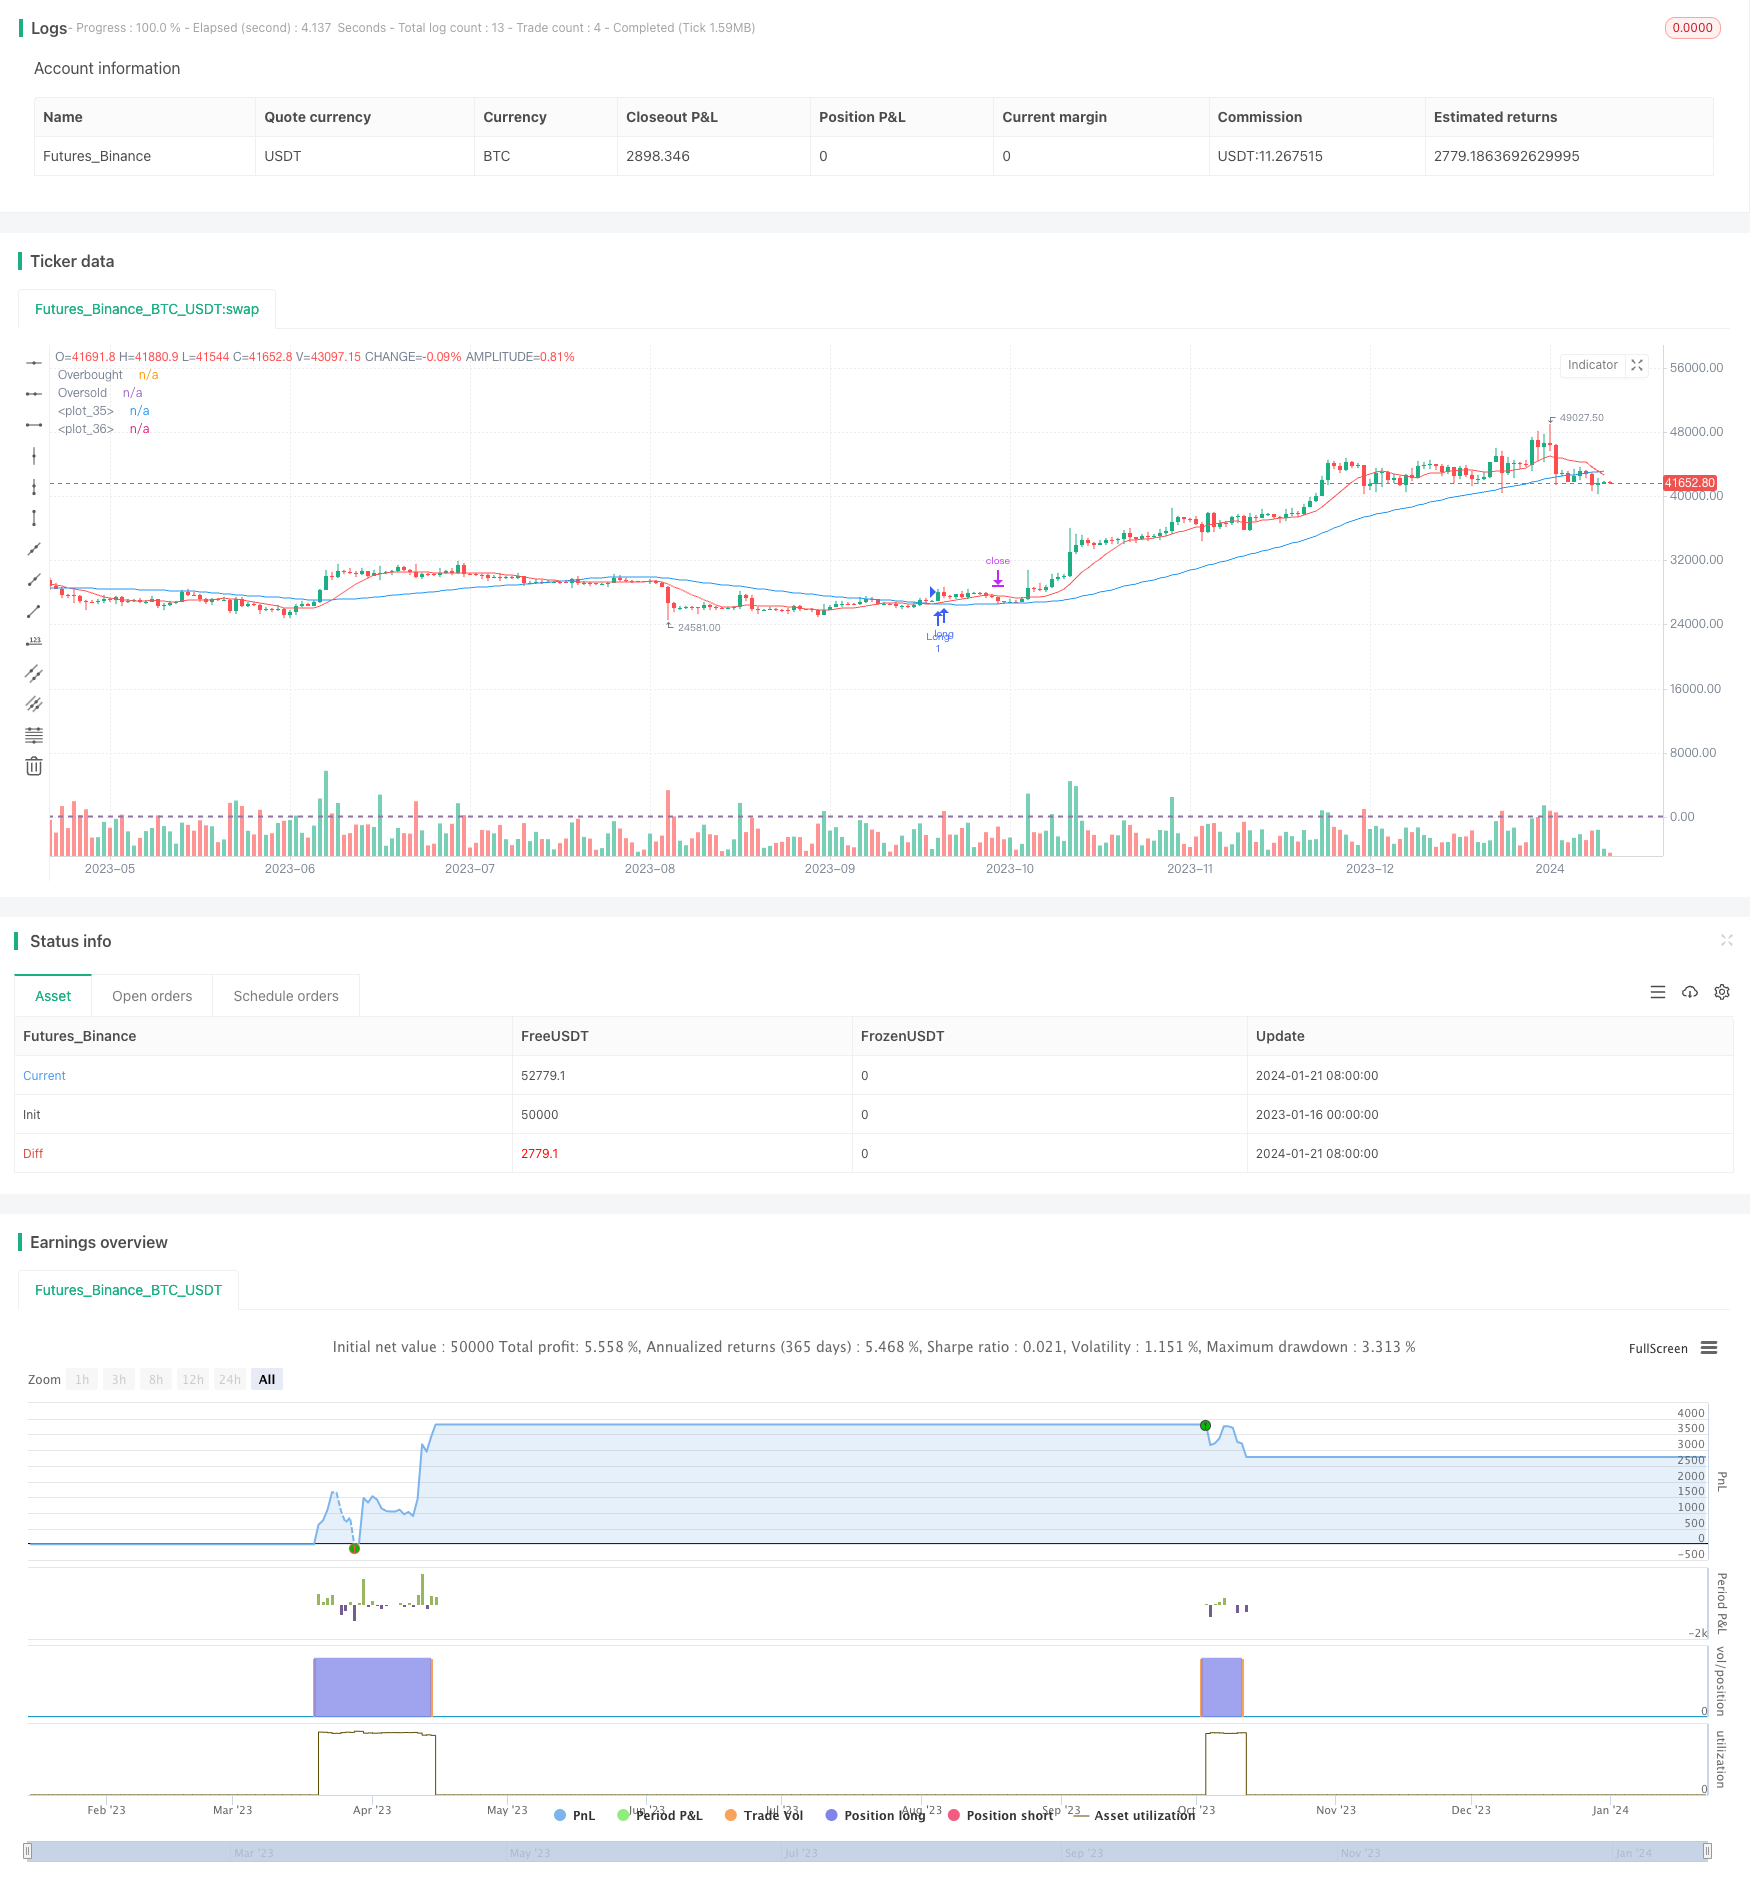
start: 2023-01-16 00:00:00
end: 2024-01-22 00:00:00
period: 1d
basePeriod: 1h
exchanges: [{"eid":"Futures_Binance","currency":"BTC_USDT"}]
*/

//@version=4
strategy("Long Only Multi-Indicator Strategy", shorttitle="LOMIS", overlay=true)

// Inputs
lengthMAFast = input(10, title="Fast MA Length")
lengthMASlow = input(50, title="Slow MA Length")
rsiLength = input(14, title="RSI Length")
rsiOverbought = input(70, title="RSI Overbought Level")
rsiOversold = input(30, title="RSI Oversold Level")
atrLength = input(14, title="ATR Length")
riskMultiplier = input(1.5, title="Risk Multiplier for SL and TP")

// Moving averages
maFast = sma(close, lengthMAFast)
maSlow = sma(close, lengthMASlow)

// RSI
rsi = rsi(close, rsiLength)

// ATR
atr = atr(atrLength)

// Long condition
longCondition = crossover(maFast, maSlow) and rsi < rsiOverbought

// Entering long trades
if (longCondition)
    strategy.entry("Long", strategy.long)
    slLong = close - atr * riskMultiplier
    tpLong = close + atr * riskMultiplier * 2
    strategy.exit("SL Long", "Long", stop=slLong)
    strategy.exit("TP Long", "Long", limit=tpLong)

// Plotting
plot(maFast, color=color.red)
plot(maSlow, color=color.blue)
hline(rsiOverbought, "Overbought", color=color.red)
hline(rsiOversold, "Oversold", color=color.blue)


More